Ages, interest rates and the whole life annuity
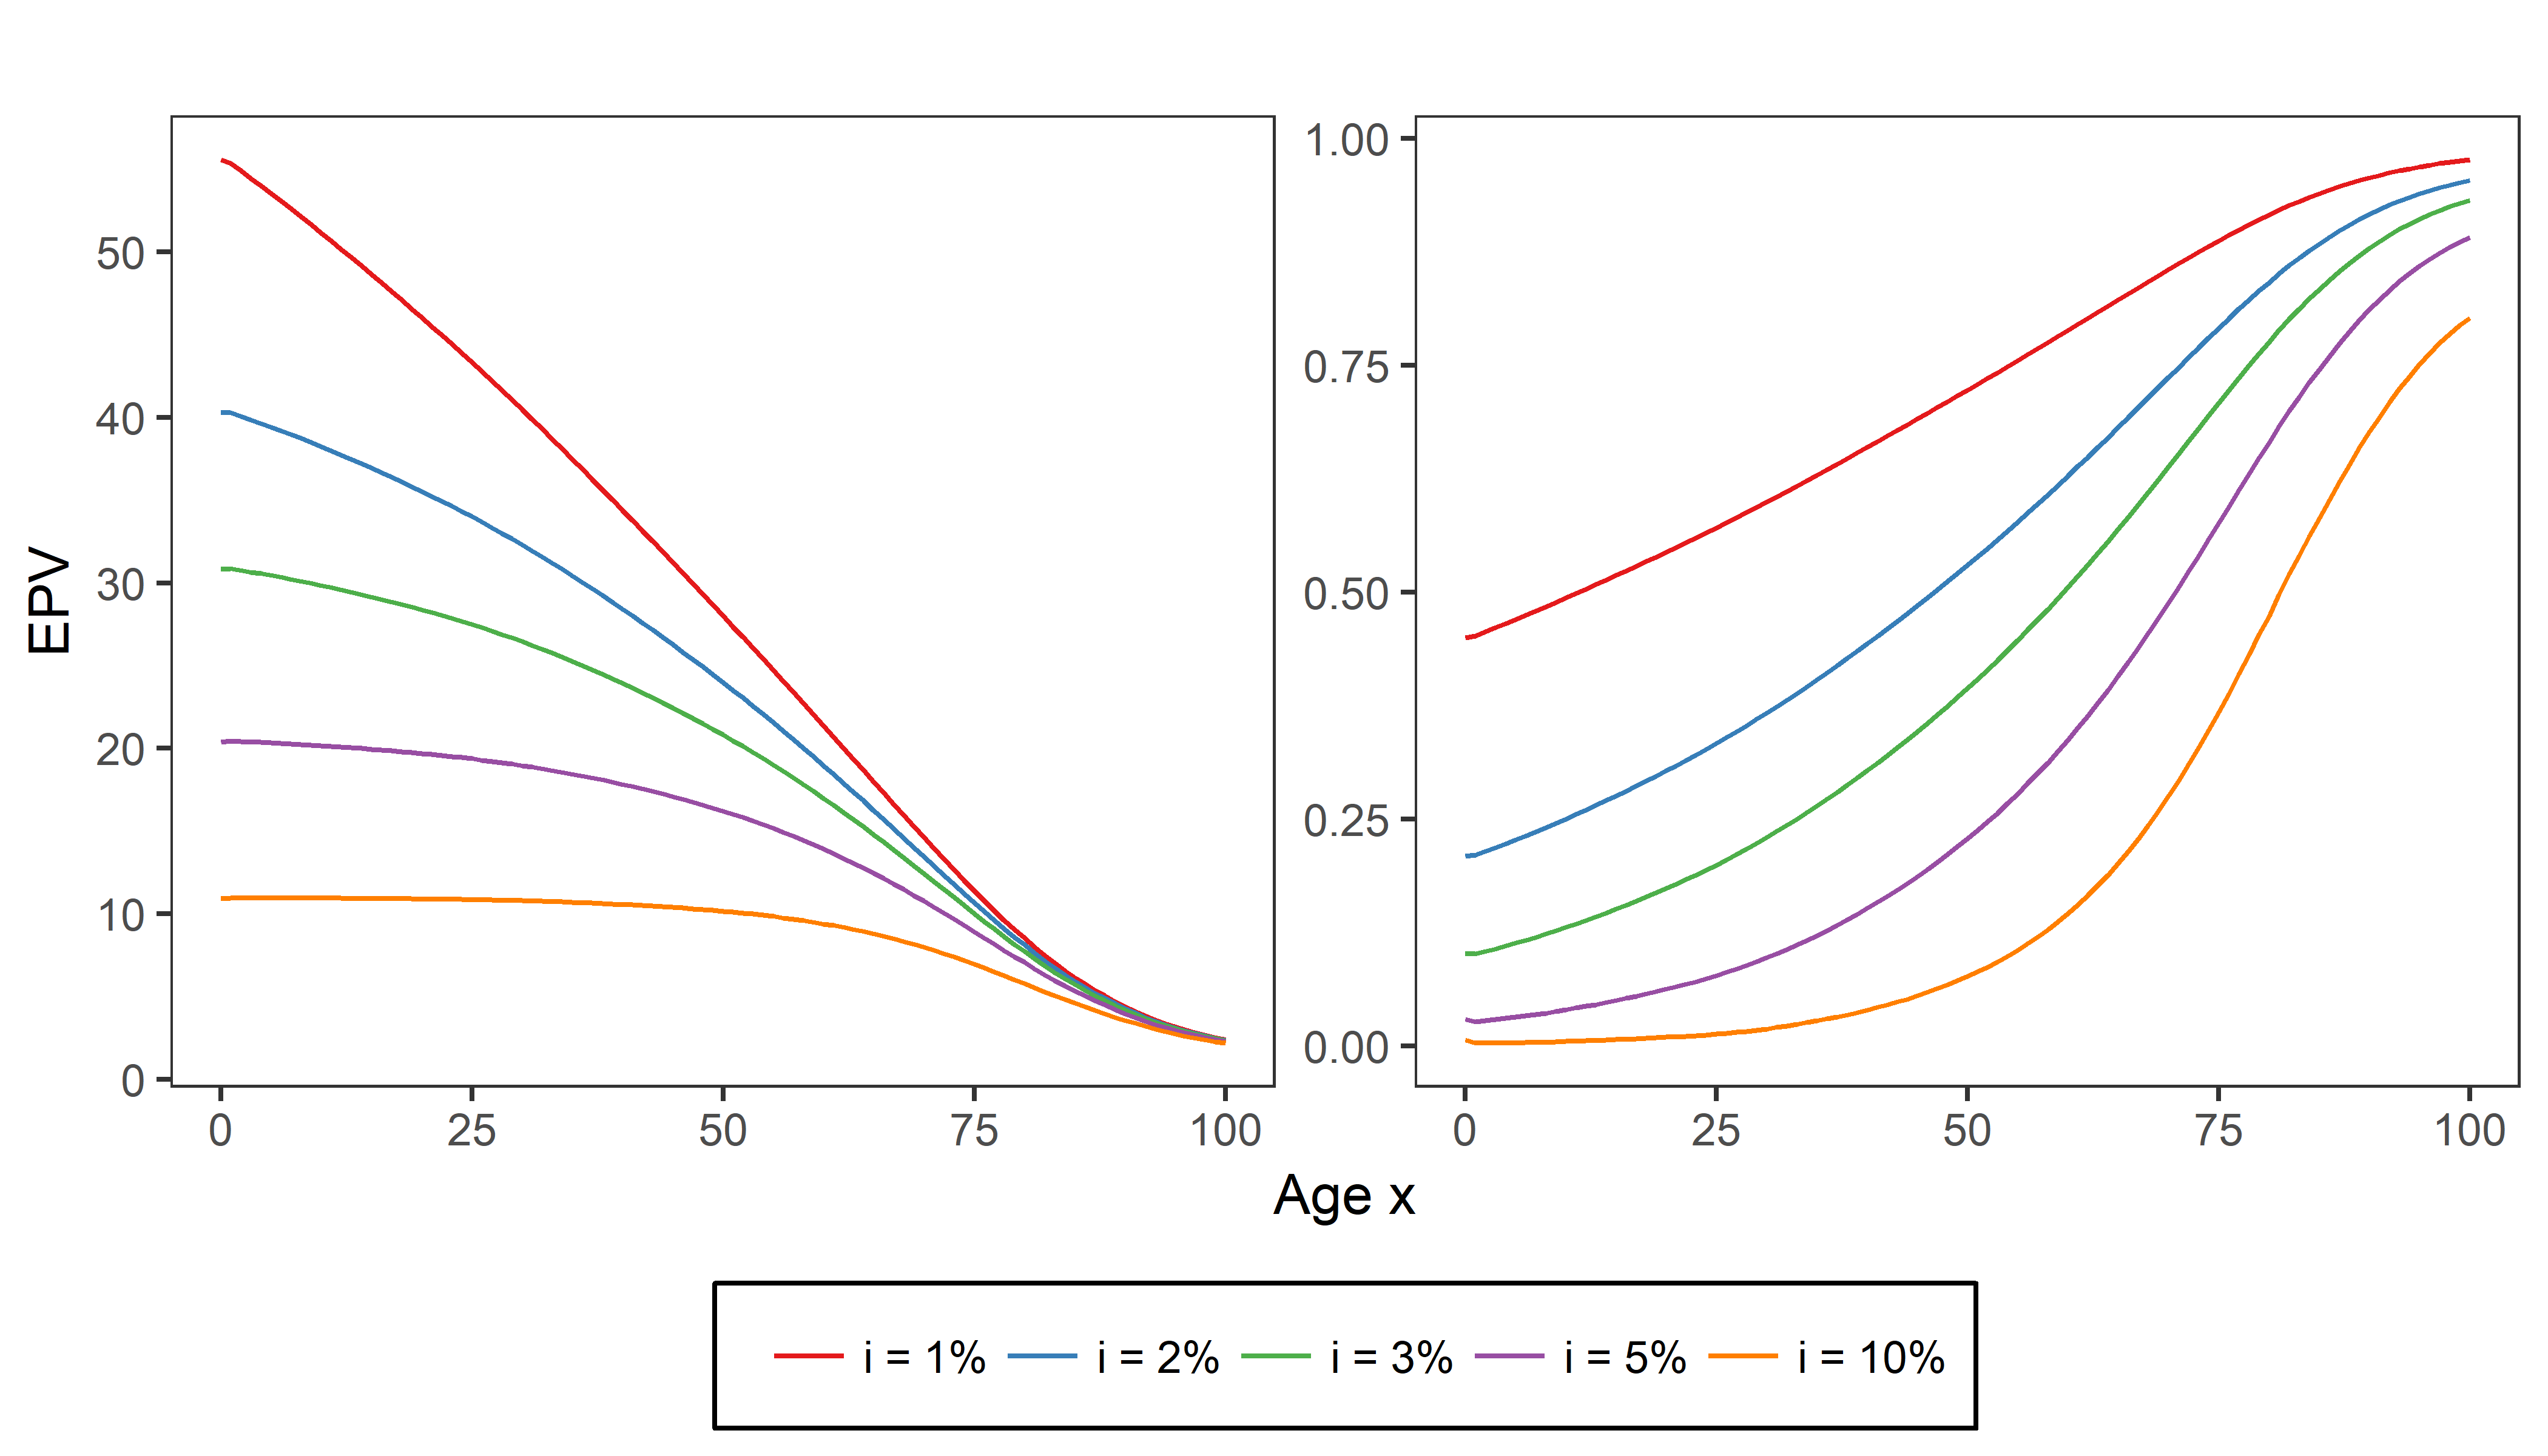
To gain some intuition, Cynthia plotted the expected present values \(\ddot{a}_x\) of a whole life annuity due (with constant benefits of 1 EUR) for varying ages \(x\) from 0 to 100 and for five different interest rates \(i\). Which of the following two figures corresponds to this graph?
Deze oefening maakt deel uit van de cursus
Life Insurance Products Valuation in R
Interactieve oefening met praktijkervaring
Zet theorie om in actie met een van onze interactieve oefeningen
 Begin oefening