Men versus women
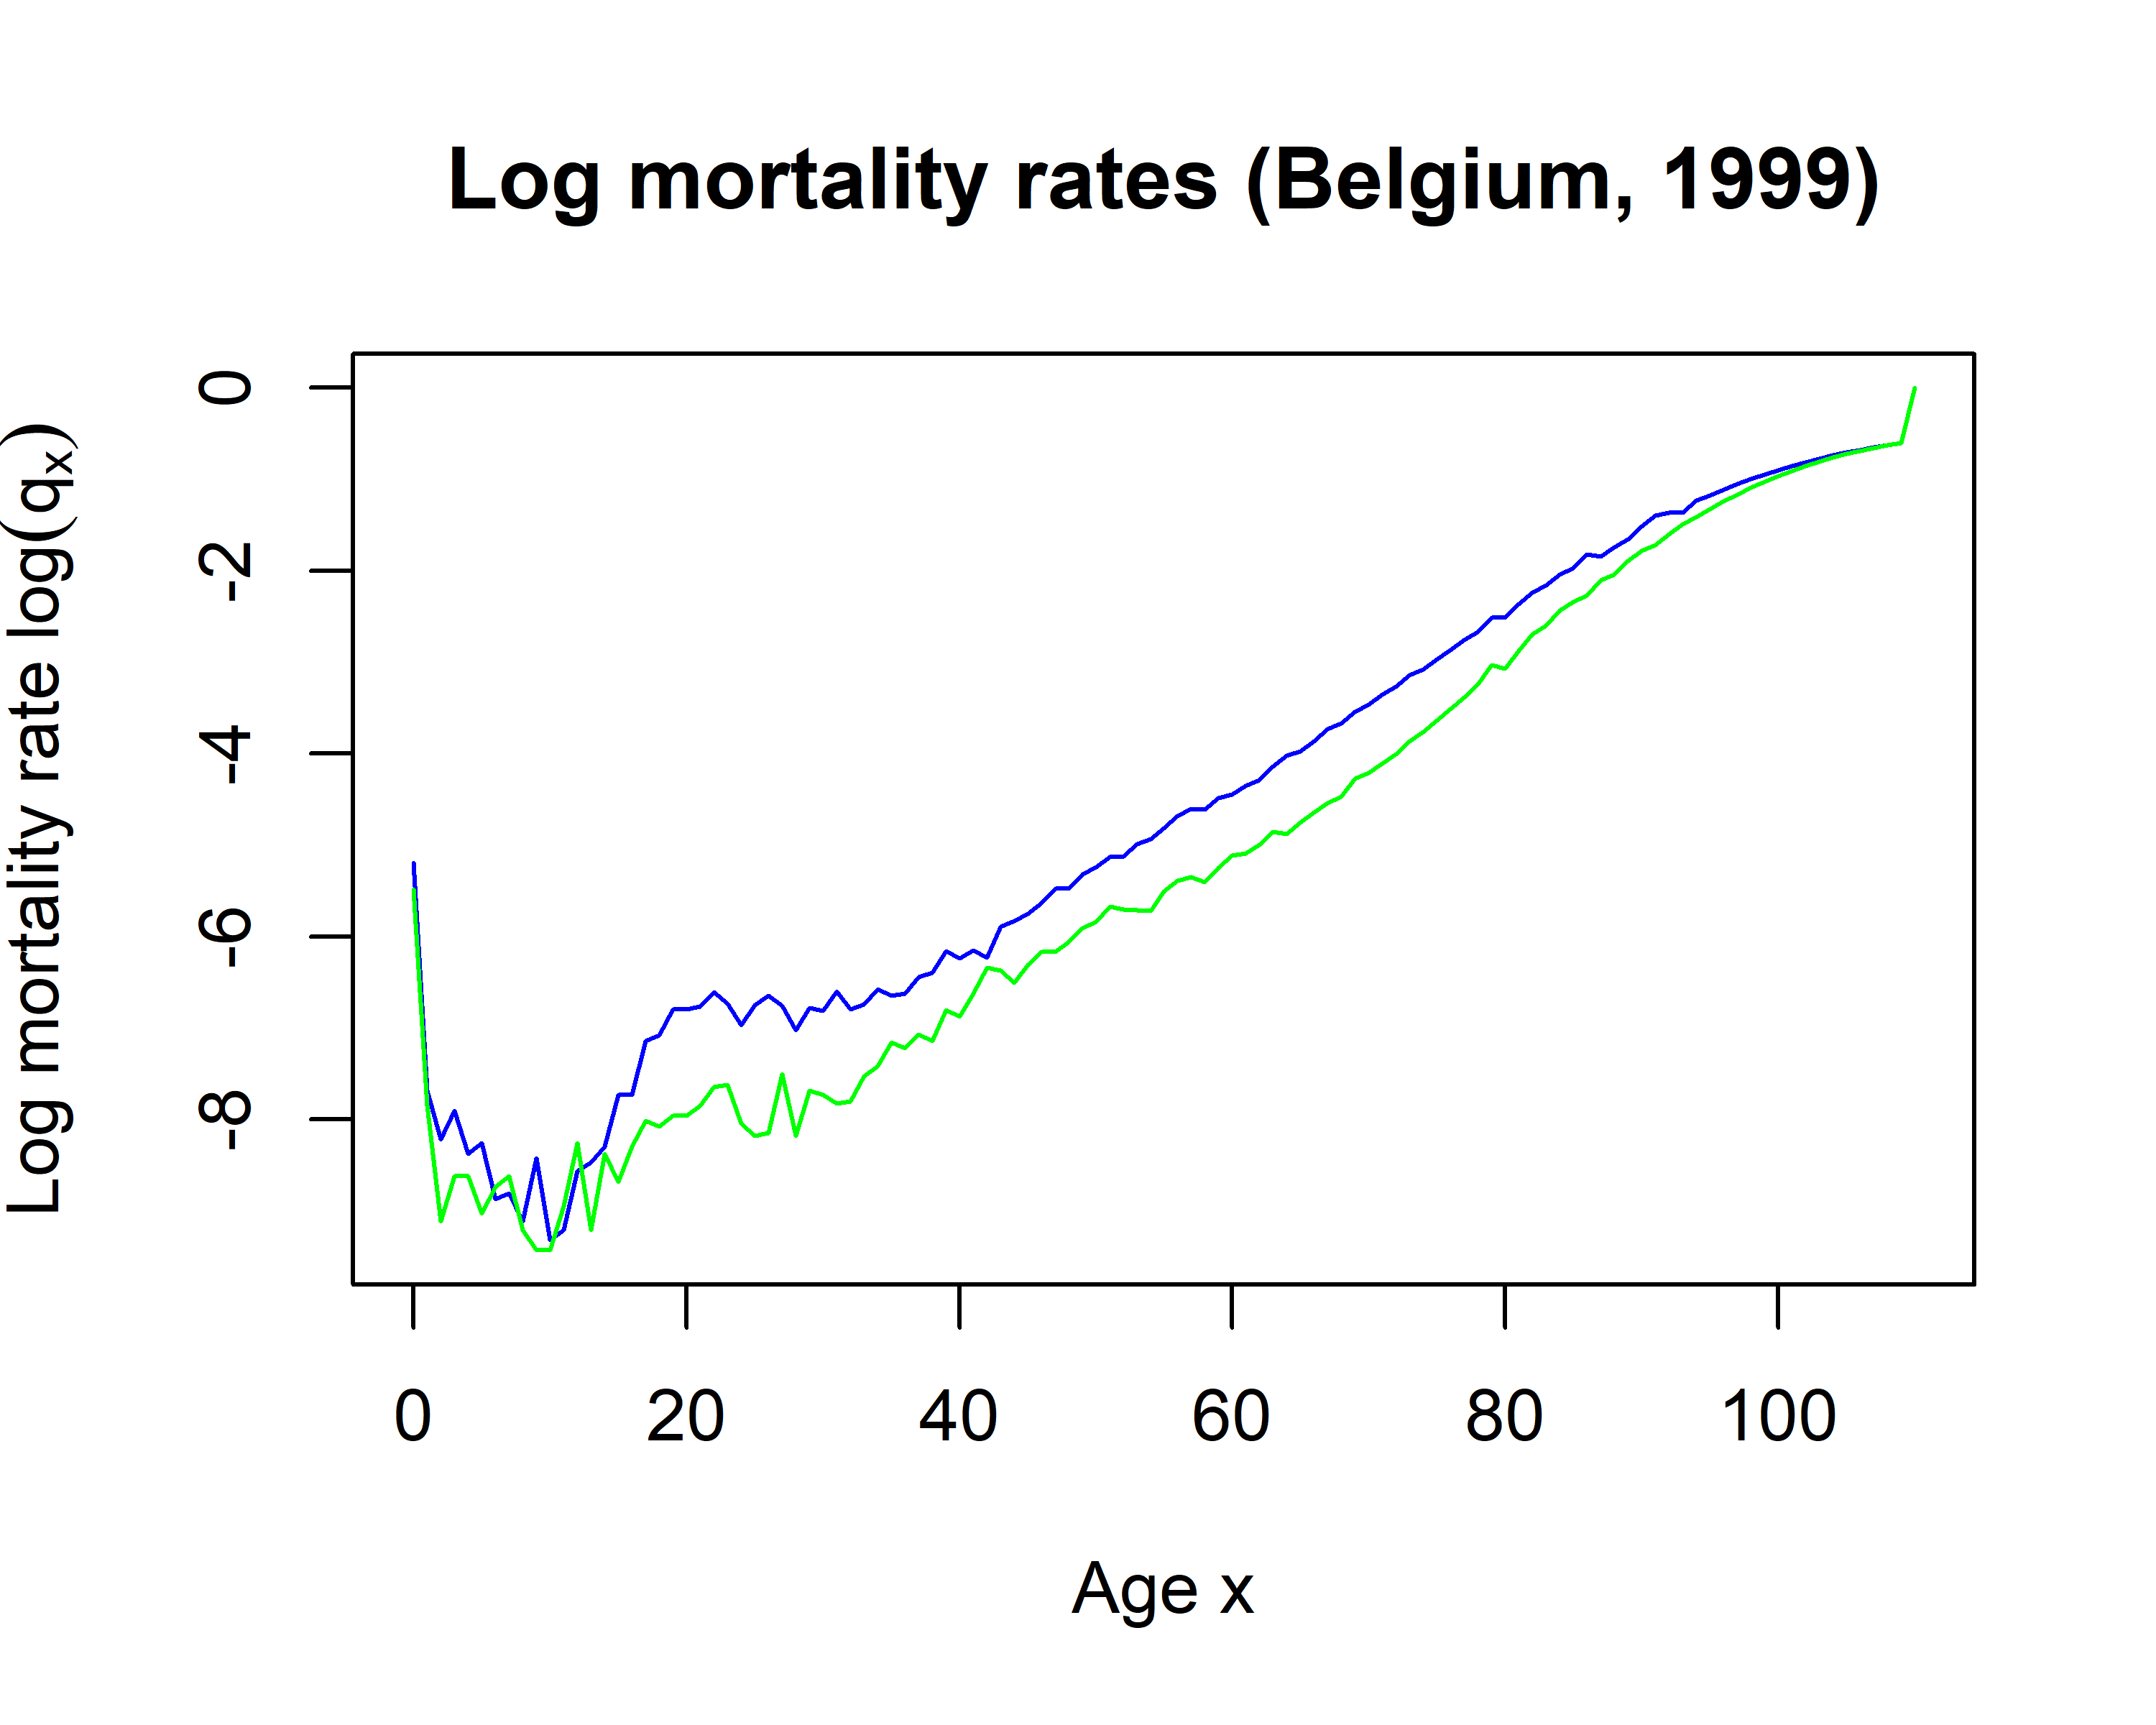
In the previous exercises, we focused on the female life table. However, there are some clear differences between the mortality statistics of men and women. Women tend to live longer since their mortality rates are lower. The accident hump is also more outspoken for men compared to women.
Examine the plot below of mortality rates for males and females in 1999. Which line, blue or green, represents the rates for women?
Deze oefening maakt deel uit van de cursus
Life Insurance Products Valuation in R
Interactieve oefening met praktijkervaring
Zet theorie om in actie met een van onze interactieve oefeningen
 Begin oefening