Ages, interest rates and the whole life annuity
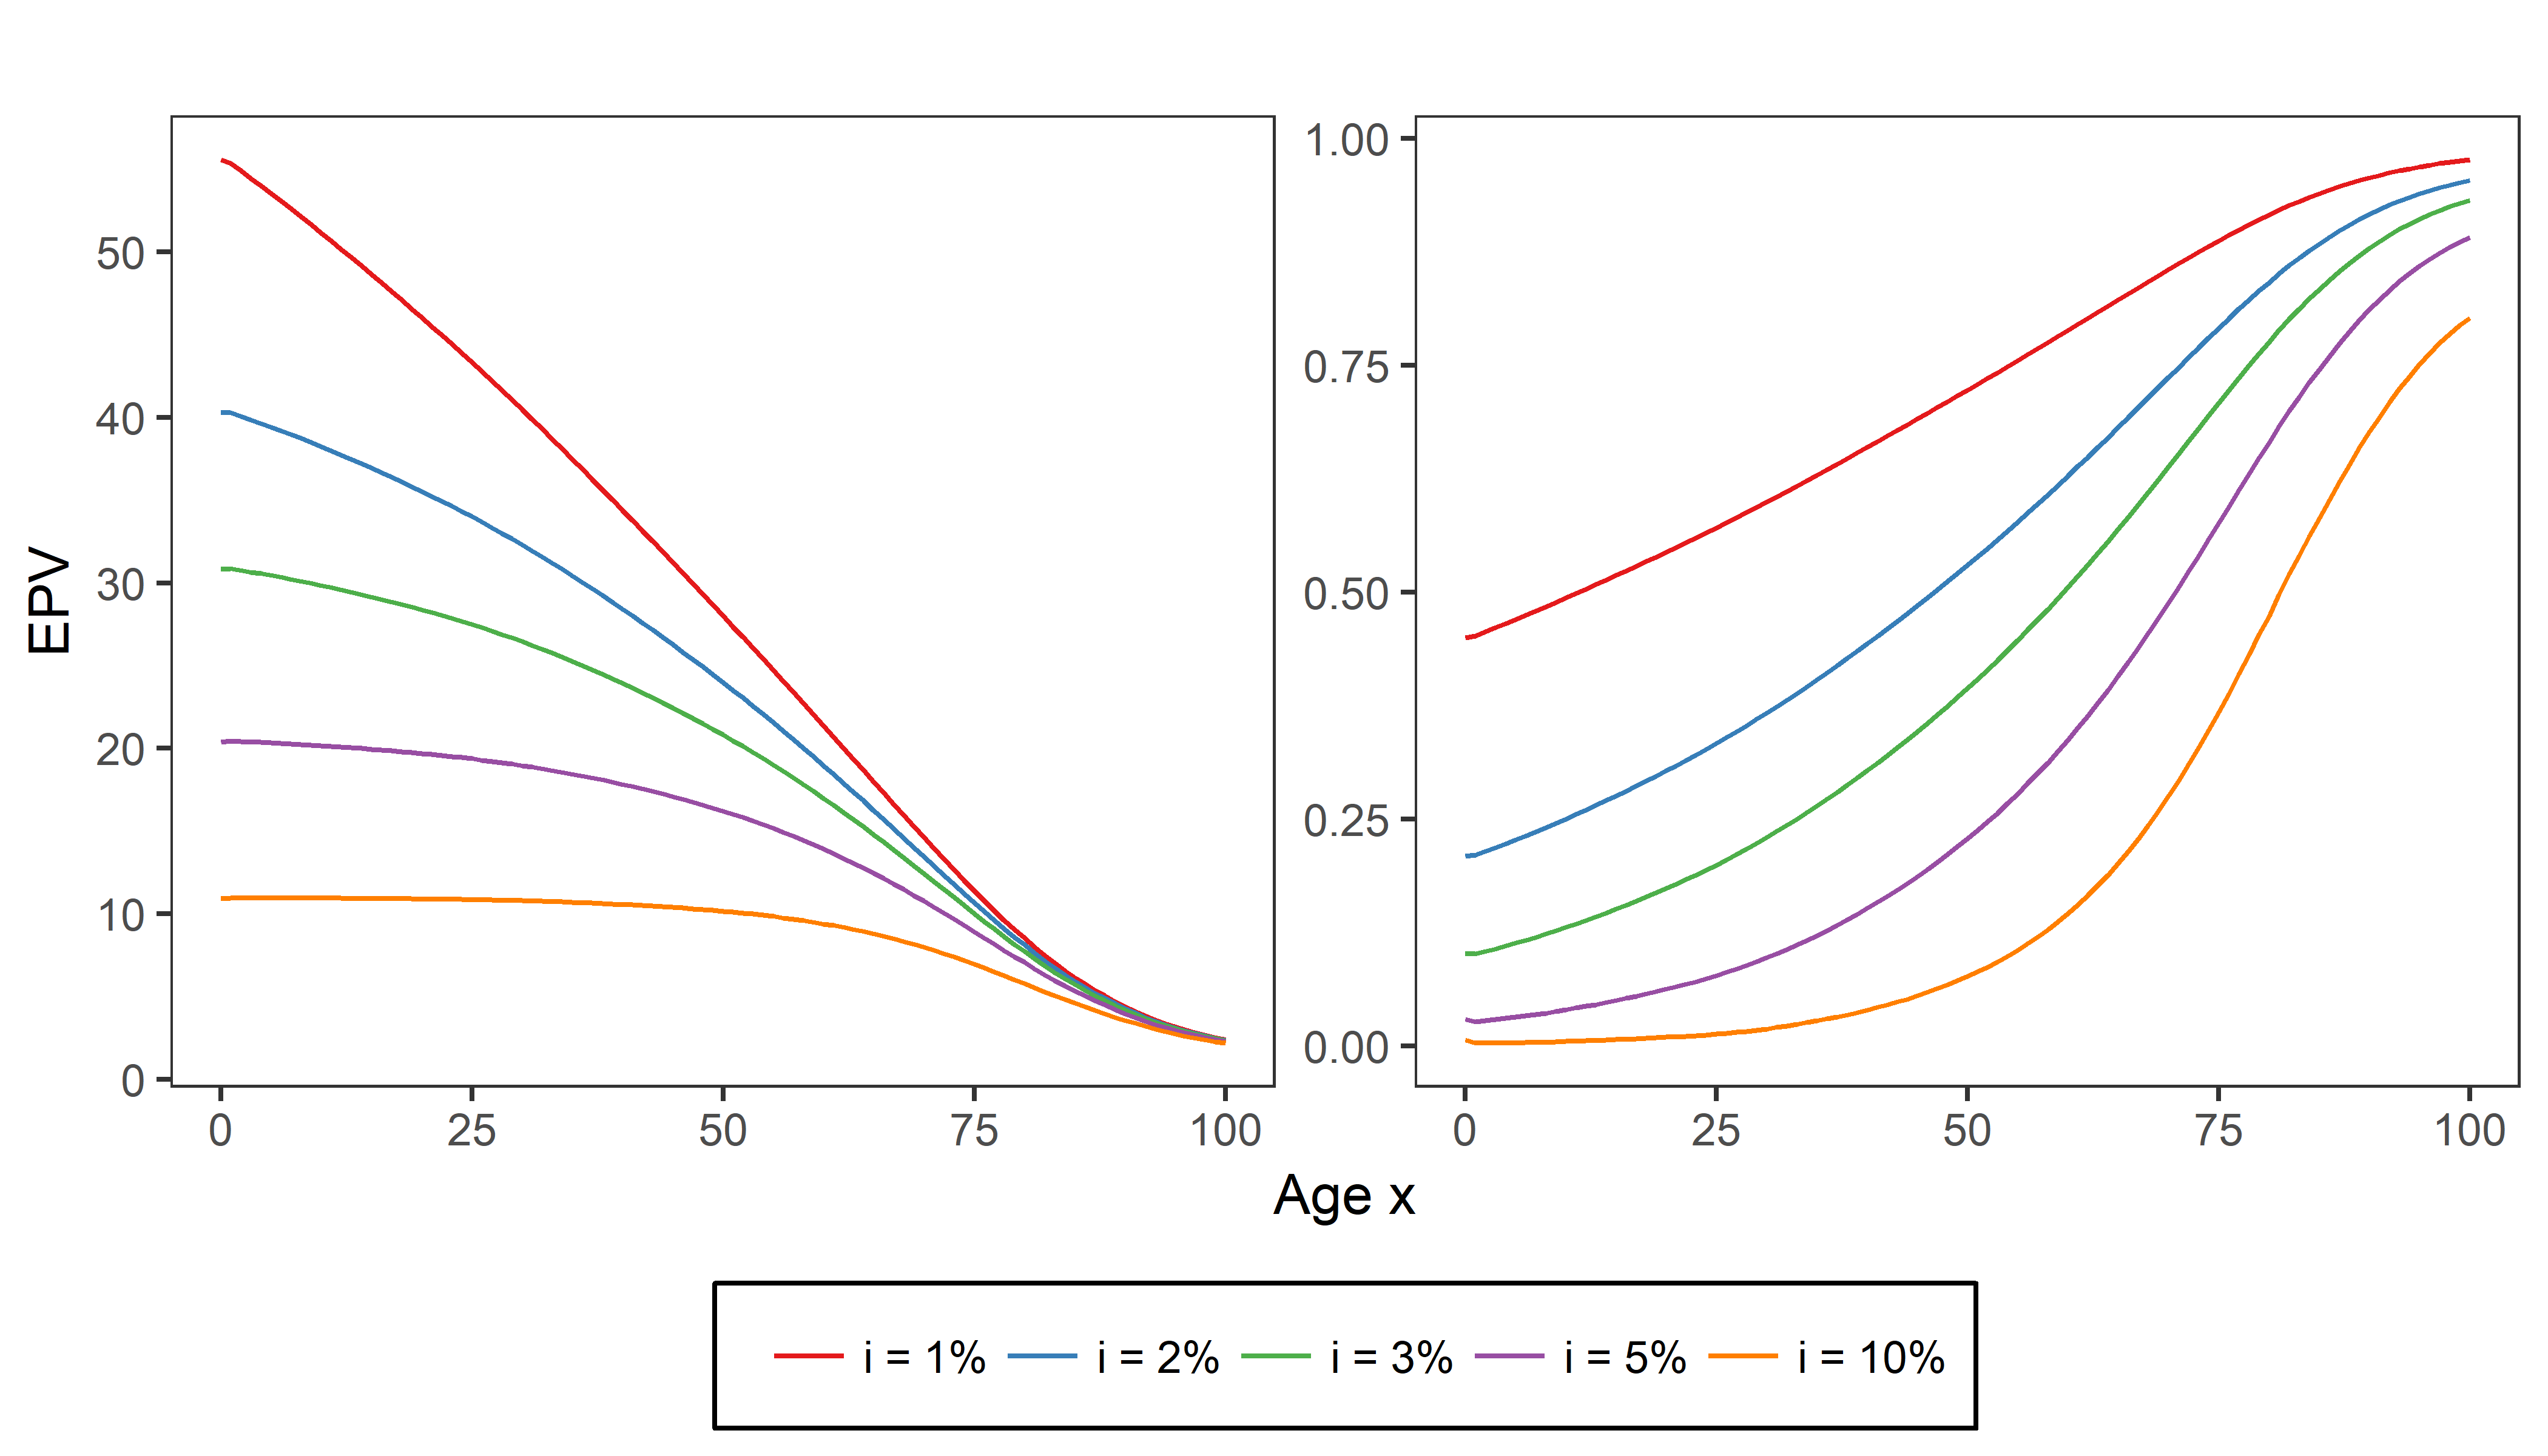
To gain some intuition, Cynthia plotted the expected present values \(\ddot{a}_x\) of a whole life annuity due (with constant benefits of 1 EUR) for varying ages \(x\) from 0 to 100 and for five different interest rates \(i\). Which of the following two figures corresponds to this graph?
Questo esercizio fa parte del corso
Life Insurance Products Valuation in R
esercizio interattivo pratico
Trasforma la teoria in pratica con uno dei nostri esercizi interattivi
 Inizia esercizio