Grafico della qualità di base
Questa figura è stata creata per te a partire dalle codifiche della qualità di base di un file fastq completo. Questo file usa la codifica Illumina. La codifica massima è I, ovvero un punteggio di 40. Le codifiche di buona qualità hanno punteggi pari o superiori a 33, in altre parole, B o superiori.
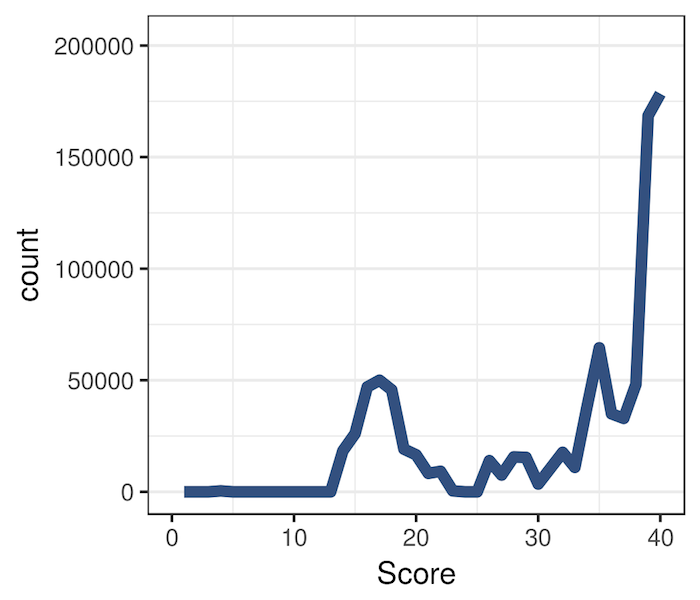
Puoi vedere i dettagli della codifica per Illumina qui.
- Quali punteggi sono maggiormente rappresentati nella figura?
Questo esercizio fa parte del corso
Introduzione a Bioconductor in R
esercizio interattivo pratico
Trasforma la teoria in pratica con uno dei nostri esercizi interattivi
 Inizia esercizio