Influenza della prior e dei dati sulla posterior
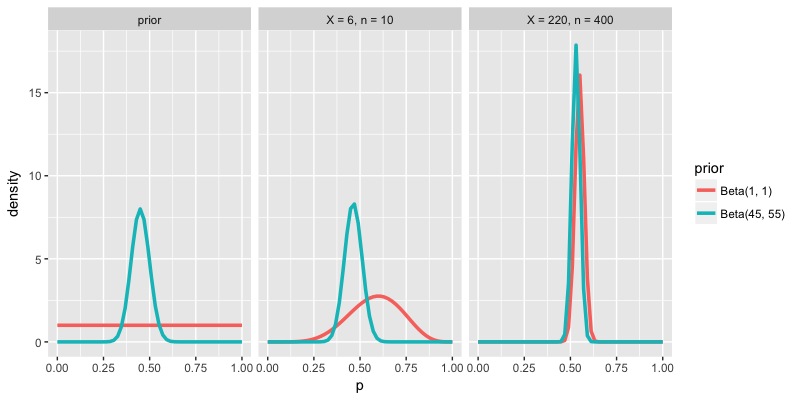
Esamina i grafici di densità qui sotto. Il primo gruppo di grafici illustra 2 possibili prior per il tuo supporto di base \(p\). Gli altri 2 gruppi mostrano i modelli posteriori per \(p\) che derivano da queste prior diverse e da diversi dati di sondaggio \(X\) e \(n\). Quale delle seguenti opzioni descrive meglio l’influenza combinata della prior e dei dati sulla posterior?
Questo esercizio fa parte del corso
Modeling bayesiano con RJAGS
esercizio interattivo pratico
Trasforma la teoria in pratica con uno dei nostri esercizi interattivi
 Inizia esercizio