Idades, taxas de juros e a anuidade vitalícia inteira
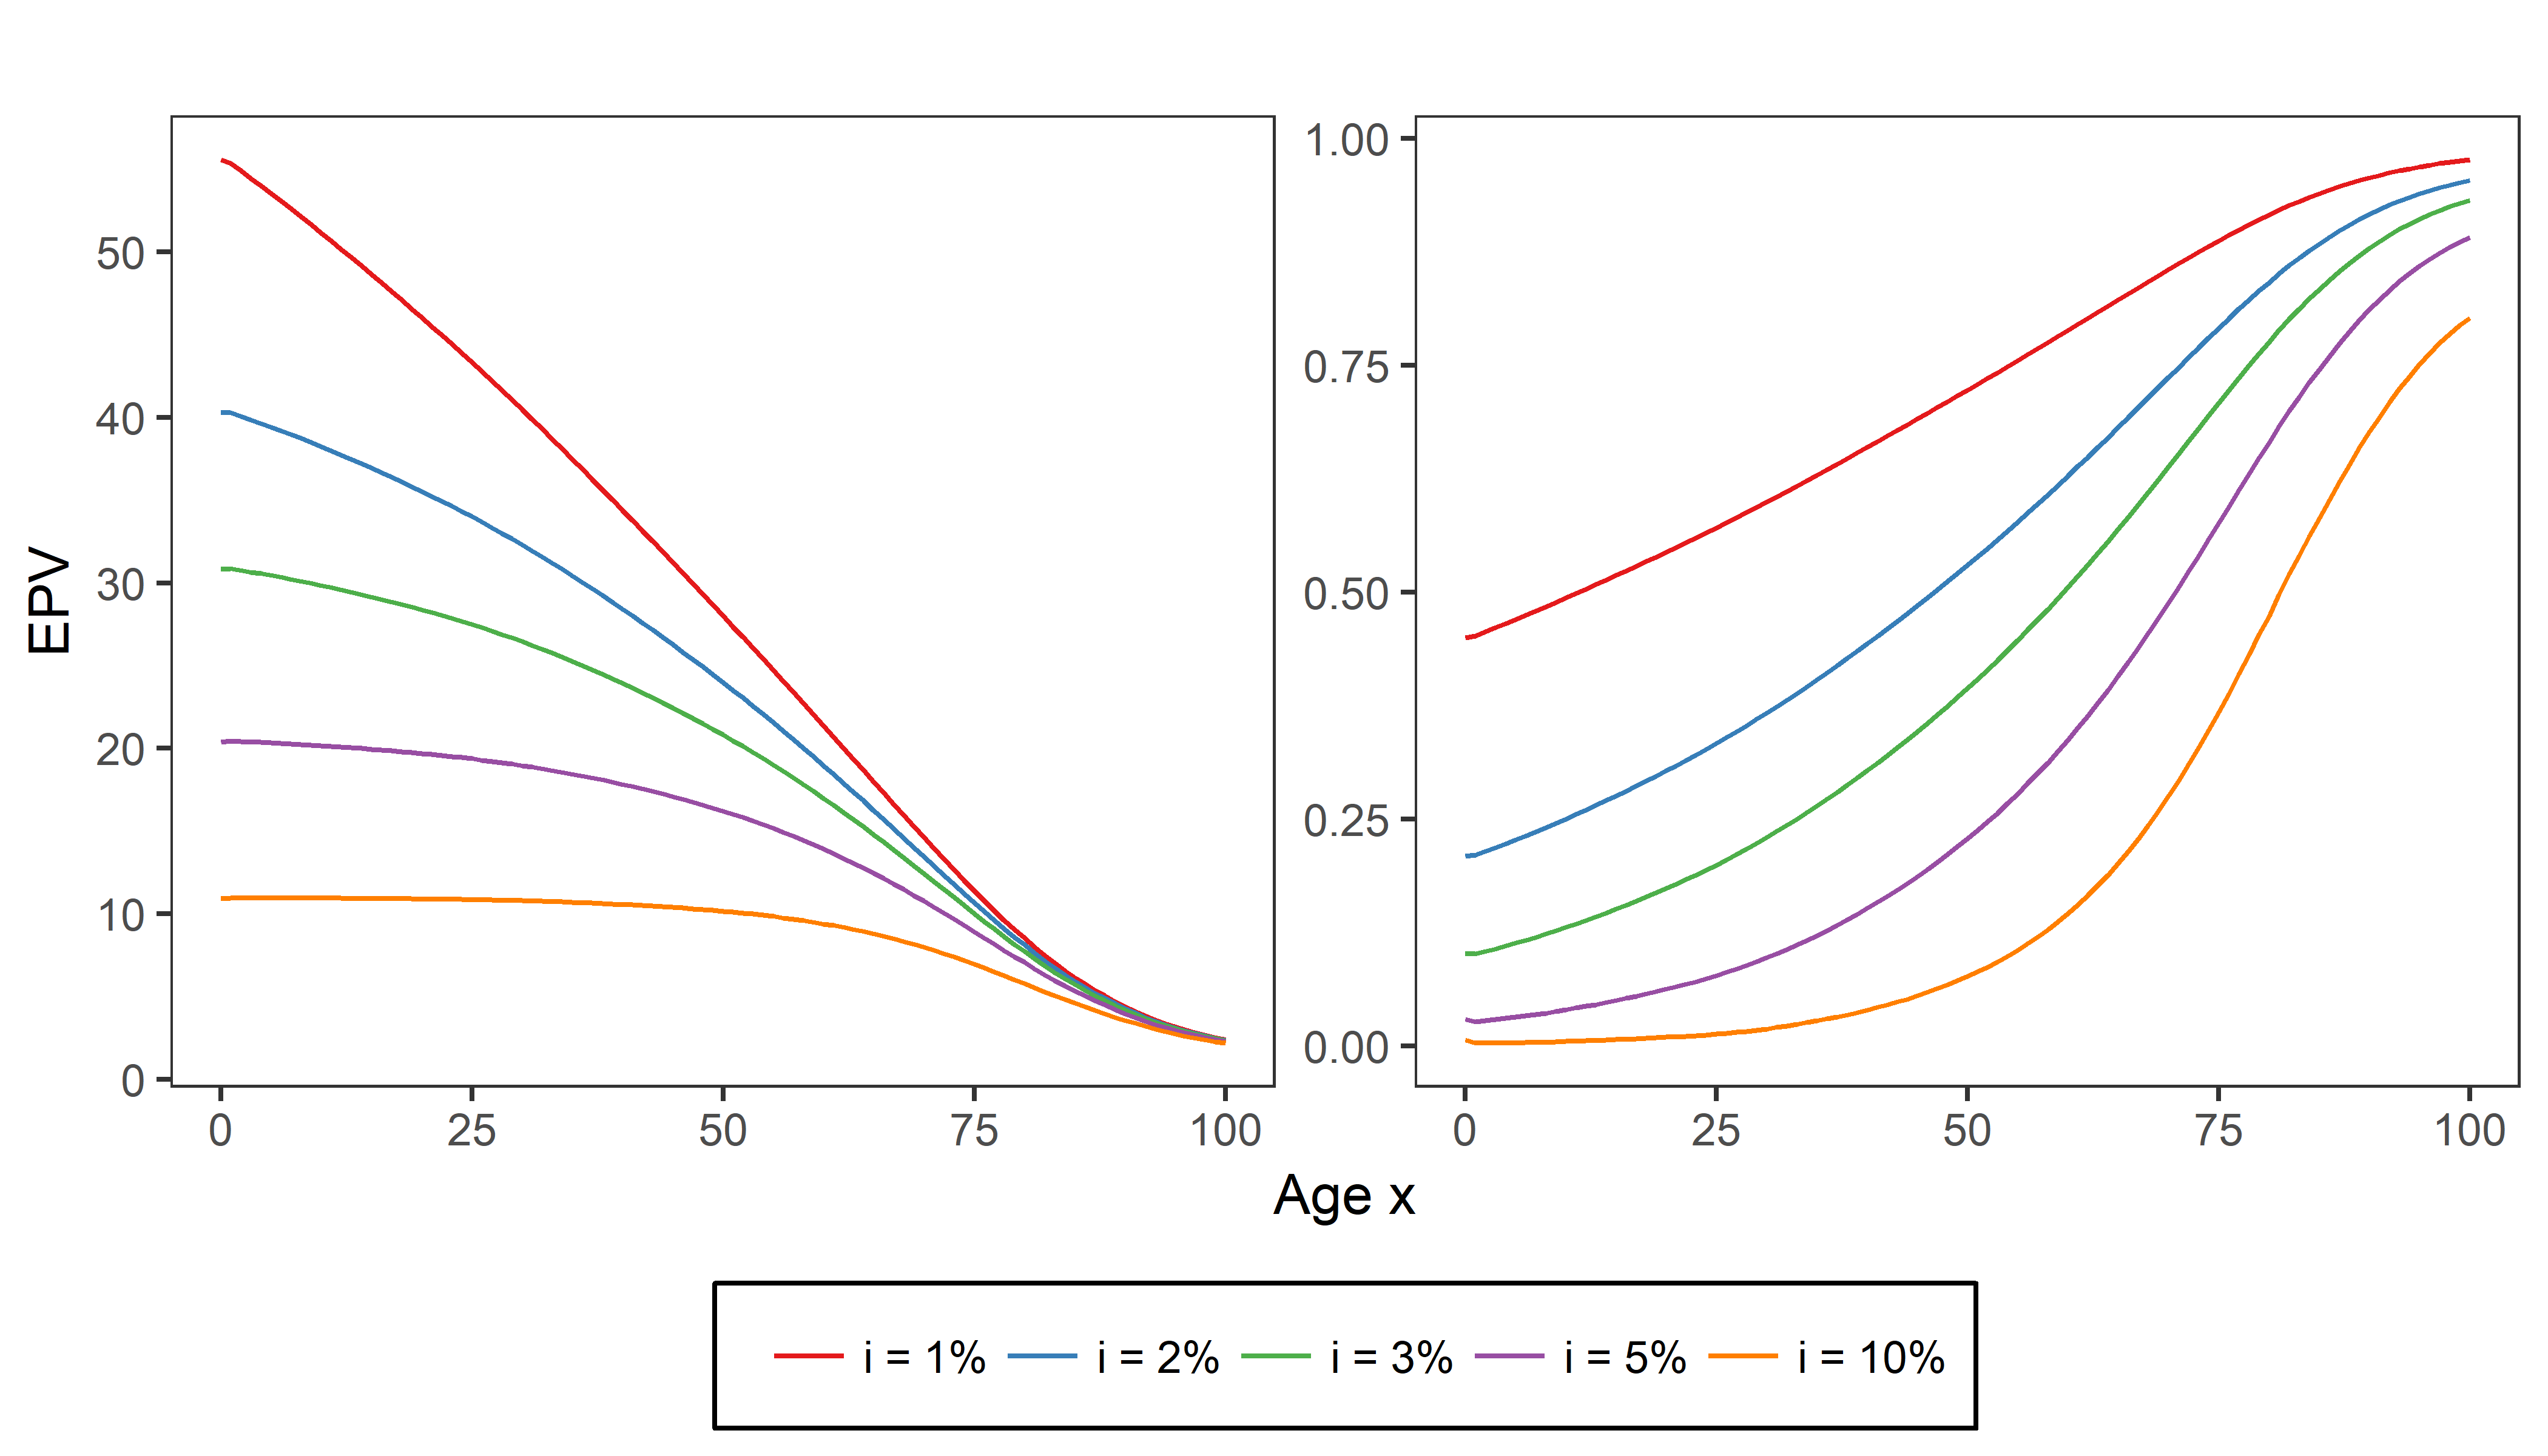
Para ganhar intuição, Cynthia traçou os valores presentes esperados \(\ddot{a}_x\) de uma anuidade vitalícia antecipada (com benefícios constantes de 1 EUR) para idades \(x\) variando de 0 a 100 e para cinco taxas de juros \(i\) diferentes. Qual das duas figuras a seguir corresponde a esse gráfico?
Este exercicio faz parte do curso
Avaliação de Produtos de Seguro de Vida em R
exercicio interativo prático
Transforme teoria em prática com um dos nossos exercicio interativos
 Iniciar exercicio