Essas amostras parecem iguais para você?
Examinar gráficos de PCA permite que você tenha uma noção das semelhanças e diferenças entre as amostras em escala global. Usando a saída gerada durante o QC das amostras, é simples gerar gráficos de PCA dos dados processados. Abaixo está um gráfico para as quatro amostras que passaram no QC.
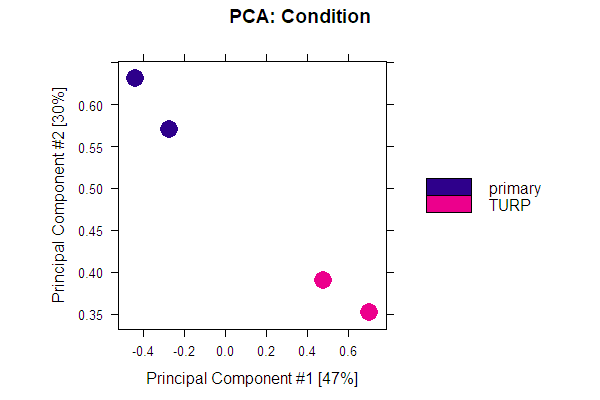
Analise o gráfico e depois avalie as afirmações a seguir. Quais são verdadeiras?
- As amostras se agrupam por condição.
- Um gráfico como este pode ser criado com a função
plotPrincomp(). - Usando um gráfico de PCA é fácil ver quais picos mais diferem entre os grupos.
Este exercicio faz parte do curso
ChIP-seq com Bioconductor em R
exercicio interativo prático
Transforme teoria em prática com um dos nossos exercicio interativos
 Iniciar exercicio