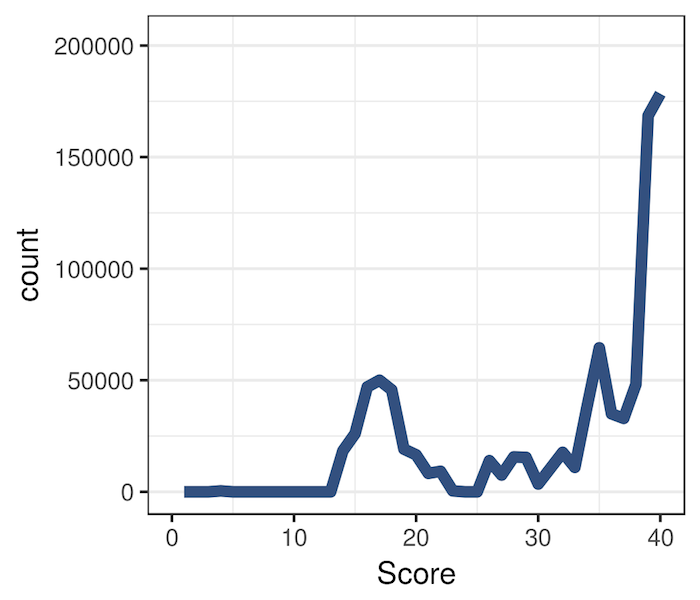
Plot van basekwaliteit
Deze figuur is voor je gemaakt op basis van de basekwaliteits-encoderingen van een volledig fastq-bestand. Dit bestand gebruikt Illumina-encodering. De
maximale encodering is I, oftewel een score van 40. Encoderingen van goede kwaliteit hebben scores van 33 of hoger, met andere woorden: B of hoger.
Je vindt de encoderingdetails voor Illumina hier.
- Welke scores komen het meest voor in de figuur?
Deze oefening maakt deel uit van de cursus
Introductie tot Bioconductor in R
Interactieve oefening met praktijkervaring
Zet theorie om in actie met een van onze interactieve oefeningen
 Begin oefening