Linear Model in Oceanography
Time-series data provides a context in which the "slope" of the linear model represents a "rate-of-change".
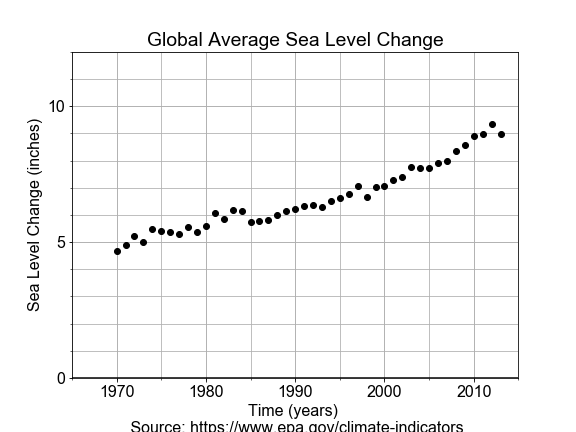
In this exercise, you will use measurements of sea level change from 1970 to 2010, build a linear model of that changing sea level and use it to make a prediction about the future sea level rise.
This exercise is part of the course
Introduction to Linear Modeling in Python
Exercise instructions
- Import and use
LinearRegression(fit_intercept=True)to initialize a linear model. - Pass in the pre-loaded and reshaped
yearsandlevelsdata intomodel.fit()to fit the model. - Use
model.predict()to predict a singlefuture_levelforfuture_year = 2100andprint()the result. - Use
model.predict()to forecast manylevels_forecastand plot the result with the pre-definedplot_data_and_forecast().
Hands-on interactive exercise
Have a go at this exercise by completing this sample code.
# Import LinearRegression class, build a model, fit to the data
from sklearn.linear_model import ____
model = ____(fit_intercept=True)
model.fit(years, levels)

# Use model to make a prediction for one year, 2100
future_year = np.array(2100).reshape(1, -1)
future_level = model.predict(____)
print("Prediction: year = {}, level = {:.02f}".format(future_year, future_level[0,0]))

# Use model to predict for many years, and over-plot with measured data
years_forecast = np.linspace(1970, 2100, 131).reshape(-1, 1)
levels_forecast = model.predict(____)
fig = plot_data_and_forecast(years, levels, ____, ____)