Slope and Rates-of-Change
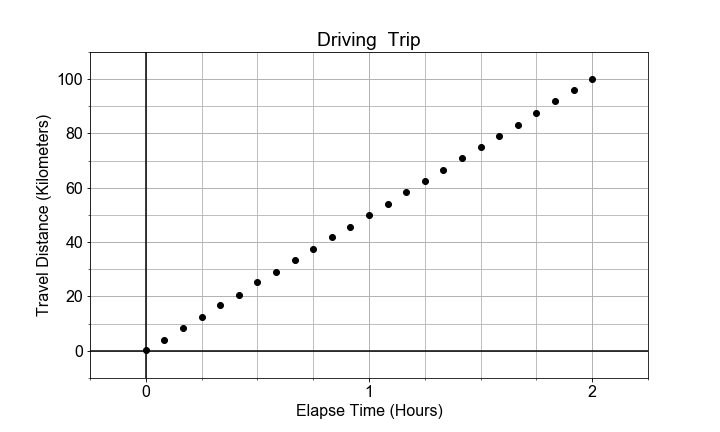
In this exercise, you will model the motion of a car driving (roughly) constant velocity by computing the average velocity over the entire trip. The linear relationship modeled is between the time elapsed and the distance traveled.
In this case, the model parameter a1, or slope, is approximated or "estimated", as the mean velocity, or put another way, the "rate-of-change" of the distance ("rise") divided by the time ("run").
This exercise is part of the course
Introduction to Linear Modeling in Python
Exercise instructions
- Compute the the point-to-point differences of both the
timesanddistancesusingnumpy.diff(). - Compute an array of
velocitiesas the ratio of thediff_distancedivided bydiff_times. - Compute the average and range of velocity values, using
numpymethodsmean,max,min. - Plot the array of
velocitiesto visualize the average and spread of the values.
Hands-on interactive exercise
Have a go at this exercise by completing this sample code.
# Compute an array of velocities as the slope between each point
diff_distances = np.diff(____)
diff_times = np.diff(____)
velocities = ____ / diff_times

# Chracterize the center and spread of the velocities
v_avg = np.____(velocities)
v_max = np.____(velocities)
v_min = np.____(velocities)
v_range = ____ - ____

# Plot the distribution of velocities
fig = plot_velocity_timeseries(times[1:], velocities)