Estimating Speed and Confidence
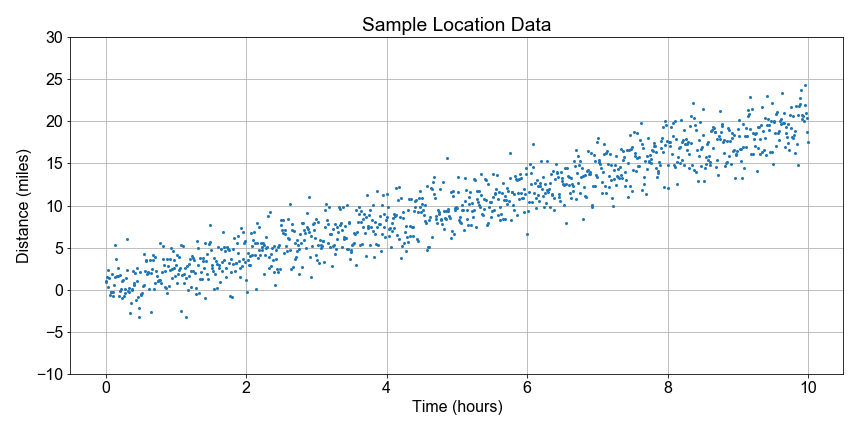
Let's continue looking at the National Park hiking data. Notice that some distances are negative because they walked in the opposite direction from the trail head; the data are messy so let's just focus on the overall trend.
In this exercise, your goal is to use boot-strap resampling to find the distribution of speed values for a linear model, and then from that distribution, compute the best estimate for the speed and the 90th percent confidence interval of that estimate. The speed here is the slope parameter from the linear regression model to fit distance as a function of time.
To get you started, we've preloaded distance and time data, together with a pre-defined least_squares() function to compute the speed value for each resample.
This exercise is part of the course
Introduction to Linear Modeling in Python
Exercise instructions
- Use
np.random.choice()to drawsample_indsfrompopulation_inds, preserving the distance-time pairing of each datum. - To preserve time ordering,
.sort()thesample_inds, and then usesample_indsto indexdistancesandtimes. - Use
least_squares(times, distances)to compute linear model parameters and storea1inresample_speeds. - Apply
np.mean()andnp.percentiles()toresample_speeds, computing speed and confidence intervalci_90, and then print both.
Hands-on interactive exercise
Have a go at this exercise by completing this sample code.
# Resample each preloaded population, and compute speed distribution
population_inds = np.arange(0, 99, dtype=int)
for nr in range(num_resamples):
    sample_inds = np.random.choice(____, size=100, replace=True)
    sample_inds.____()
    sample_distances = distances[____]
    sample_times = times[____]
    a0, a1 = ____(sample_times, sample_distances)
    resample_speeds[nr] = ____

# Compute effect size and confidence interval, and print
speed_estimate = np.mean(____)
ci_90 = np.percentile(____, [5, 95])
print('Speed Estimate = {:0.2f}, 90% Confidence Interval: {:0.2f}, {:0.2f} '.format(____, ____[0], ____[1]))