Mean, Deviation, & Standard Deviation
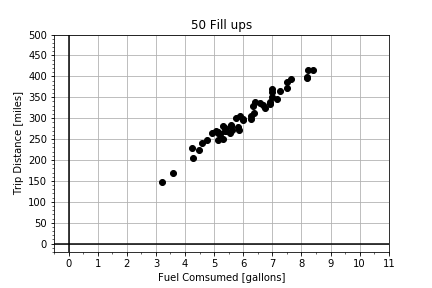
The mean describes the center of the data. The standard deviation describes the spread of the data. But to compare two variables, it is convenient to normalize both. In this exercise, you are provided with two arrays of data, which are highly correlated, and you will compute and visualize the normalized deviations of each array.
This exercise is part of the course
Introduction to Linear Modeling in Python
Exercise instructions
- Compute the deviations
dxanddy. - Compute the normalized deviations
zxandzy. - Call
plot_cdfs()to see how both the raw and the normalized data compares.
Hands-on interactive exercise
Have a go at this exercise by completing this sample code.
# Compute the deviations by subtracting the mean offset
dx = x - np.____(x)
dy = y - np.____(y)

# Normalize the data by dividing the deviations by the standard deviation
zx = dx / np.____(x)
zy = dy / np.____(y)

# Plot comparisons of the raw data and the normalized data
fig = plot_cdfs(dx, dy, zx, zy)