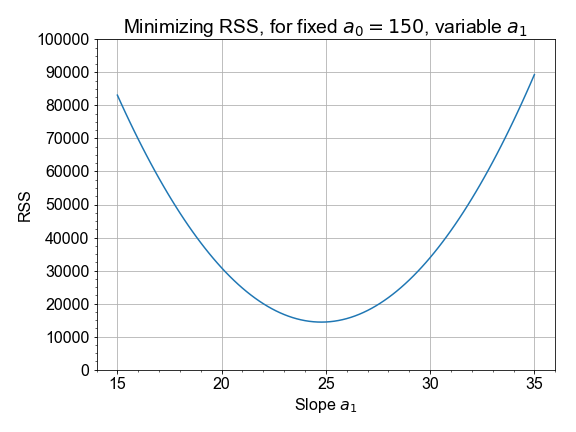
Visualizing the RSS Minima
In this exercise you will compute and visualize how RSS varies for different values of model parameters. Start by holding the intercept constant, but vary the slope: and for each slope value, you'll compute the model values, and the resulting RSS. Once you have an array of RSS values, you will determine minimal RSS value, in code, and from that minimum, determine the slope that resulted in that minimal RSS.
Use pre-loaded data arrays x_data, y_data, and empty container rss_list to get started.
This exercise is part of the course
Introduction to Linear Modeling in Python
Exercise instructions
- For each trial value
a1ina1_array, usemodel()to predict the model value, and thencompute_rss()withy_data, y_model, store the outputrss_valueinrss_list. - Convert
rss_listto anp.array(), then usenp.min()to find the minimum value inrss_array. - Use
np.where()to find the corresponding trial value and assign the result tobest_a1. - Use
plot_rss_vs_parameters()to visually confirm your values agree with the figure shown.
Hands-on interactive exercise
Have a go at this exercise by completing this sample code.
# Loop over all trial values in a1_array, computing rss for each
a1_array = np.linspace(15, 35, 101)
for a1_trial in a1_array:
    y_model = model(x_data, a0=150, a1=____)
    rss_value = compute_rss(y_data, ____)
    rss_list.append(____)

# Find the minimum RSS and the a1 value from whence it came
rss_array = np.array(____)
best_rss = np.min(____)
best_a1 = a1_array[np.where(rss_array==____)]
print('The minimum RSS = {}, came from a1 = {}'.format(best_rss, best_a1))

# Plot your rss and a1 values to confirm answer
fig = plot_rss_vs_a1(a1_array, rss_array)