R-Squared
Previously, we expressed another measure of goodness, R-squared, in terms of a ratio of RSS to VAR. Multiplying top and bottom of the ratio by 1/n, the numerical equivalent form can be seen as the ratio of the variance of the residuals divided by the variance of the linear trend in the data we are modeling. This can be interpreted as a measure of how much of the variance in your data is "explained" by your model, in contrast to the spread or variance of the residuals (after you've removed the linear trend).
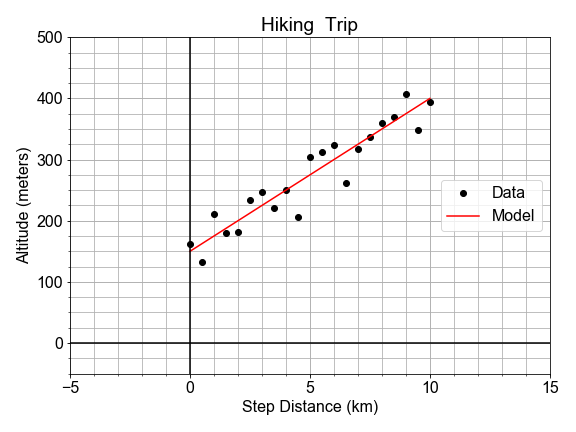
Here we have pre-loaded the data x_data,y_data and the model predictions y_model for the best fit model; your goal is to compute the R-squared measure to quantify how much this linear model accounts for variation in the data.
This exercise is part of the course
Introduction to Linear Modeling in Python
Exercise instructions
- Compute the
residuals, by subtracting they_datafrom they_model, and thedeviations, by subtracting they_datafrom thenp.mean()of they_data. - Compute the variance of the
residualsand the variance of thedeviations, usingnp.mean()andnp.square()to each. - Compute the
r_squaredas 1 minus the ratiovar_residuals / var_deviations, and print the result.
Hands-on interactive exercise
Have a go at this exercise by completing this sample code.
# Compute the residuals and the deviations
residuals = ____ - y_data
deviations = np.____(____) - y_data

# Compute the variance of the residuals and deviations
var_residuals = np.____(np.____(____))
var_deviations = np.____(np.____(____))

# Compute r_squared as 1 - the ratio of RSS/Variance
r_squared = 1 - (____ / ____)
print('R-squared is {:0.2f}'.format(____))