Interpolation: Inbetween Times
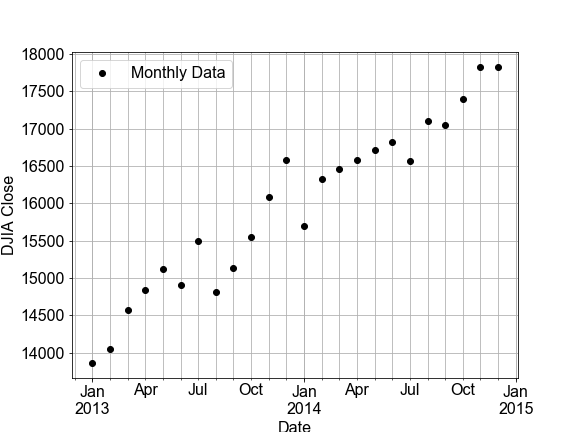
In this exercise, you will build a linear model by fitting monthly time-series data for the Dow Jones Industrial Average (DJIA) and then use that model to make predictions for daily data (in effect, an interpolation). Then you will compare that daily prediction to the real daily DJIA data.
A few notes on the data. "OHLC" stands for "Open-High-Low-Close", which is usually daily data, for example the opening and closing prices, and the highest and lowest prices, for a stock in a given day. "DayCount" is an integer number of days from start of the data collection.
This exercise is part of the course
Introduction to Linear Modeling in Python
Exercise instructions
- Use
ols()to.fit()a model to thedata=df_monthlywithformula="Close ~ DayCount". - Use
model_fit.predict()on bothdf_monthly.DayCountanddf_daily.DayCountto predict values for the monthly and dailyCloseprices, stored as a new columnModelin each DataFrame. - Use the predefined
plot_model_with_datatwice, on eachdf_monthlyanddf_dailyand compare the RSS values shown.
Hands-on interactive exercise
Have a go at this exercise by completing this sample code.
# build and fit a model to the df_monthly data
model_fit = ols('Close ~ DayCount', ____=df_monthly).____()

# Use the model FIT to the MONTHLY data to make a predictions for both monthly and daily data
df_monthly['Model'] = model_fit.____(df_monthly.____)
df_daily['Model'] = model_fit.____(df_daily.____)

# Plot the monthly and daily data and model, compare the RSS values seen on the figures
fig_monthly = plot_model_with_data(____)
fig_daily = plot_model_with_data(____)