Covariance vs Correlation
Covariance is a measure of whether two variables change ("vary") together. It is calculated by computing the products, point-by-point, of the deviations seen in the previous exercise, dx[n]*dy[n], and then finding the average of all those products.
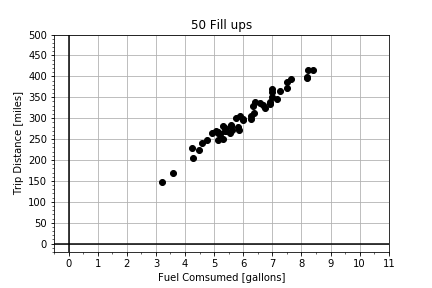
Correlation is in essence the normalized covariance. In this exercise, you are provided with two arrays of data, which are highly correlated, and you will visualize and compute both the covariance and the correlation.

This exercise is part of the course
Introduction to Linear Modeling in Python
Exercise instructions
- Compute the deviations,
dxanddyby subtracting the mean, usingnp.mean(), and computecovarianceas the mean of their productdx*dy. - Compute the normalize deviations,
zxandzy, by dividing by the standard deviation, usingnp.std(), and compute thecorrelationas the mean of their product,zx*zy. - Use
plot_normalized_deviations(zx, zy)to plot the product of the normalized deviations and visually check it against the correlation value.
Hands-on interactive exercise
Have a go at this exercise by completing this sample code.
# Compute the covariance from the deviations.
dx = x - np.____(x)
dy = y - np.____(y)
covariance = np.____(____ * ____)
print("Covariance: ", covariance)

# Compute the correlation from the normalized deviations.
zx = dx / np.____(x)
zy = dy / np.____(y)
correlation = np.____(____ * ____)
print("Correlation: ", correlation)

# Plot the normalized deviations for visual inspection.
fig = plot_normalized_deviations(zx, zy)