Sample Statistics versus Population
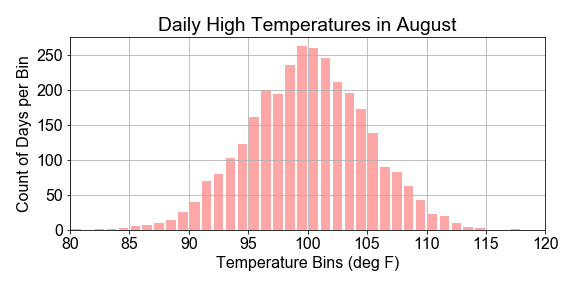
In this exercise you will work with a preloaded population. You will construct a sample by drawing points at random from the population. You will compute the mean standard deviation of the sample taken from that population to test whether the sample is representative of the population. Your goal is to see where the sample statistics are the same or very close to the population statistics.
This exercise is part of the course
Introduction to Linear Modeling in Python
Exercise instructions
- Compute and print the mean and standard deviation of the
populationdata. - Use the
np.random.seed()method to setnumpy's pseudorandom sampler seed as42. - Use
np.random.choice()to create asampleofsize=31, where size is the number of points drawn from thepopulation. - Compute and print the mean and standard deviation of the
sampleand inspect the printed values of the sample statistics and population statistics to see whether they differ.
Hands-on interactive exercise
Have a go at this exercise by completing this sample code.
# Compute the population statistics
print("Population mean {:.1f}, stdev {:.2f}".format( population.____(), population.____() ))

# Set random seed for reproducibility
____.____.____(42)

# Construct a sample by randomly sampling 31 points from the population
sample = np.____.____(____, size=31)

# Compare sample statistics to the population statistics
print("    Sample mean {:.1f}, stdev {:.2f}".format( sample.____(), sample.____() ))