Correlation Strength
Intuitively, we can look at the plots provided and "see" whether the two variables seem to "vary together".
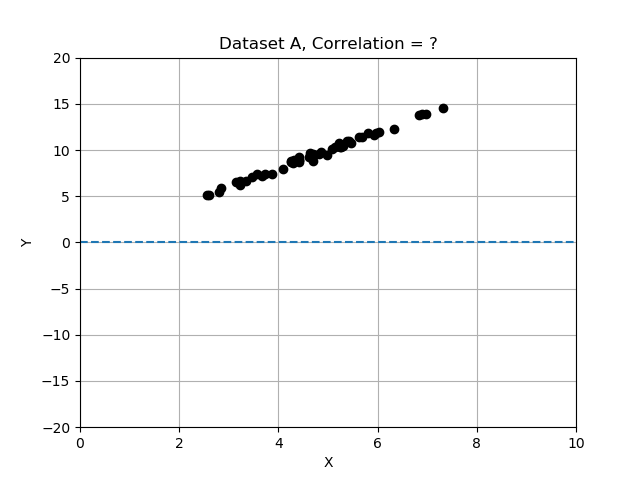
- Data Set A: x and y change together and appear to have a strong relationship.
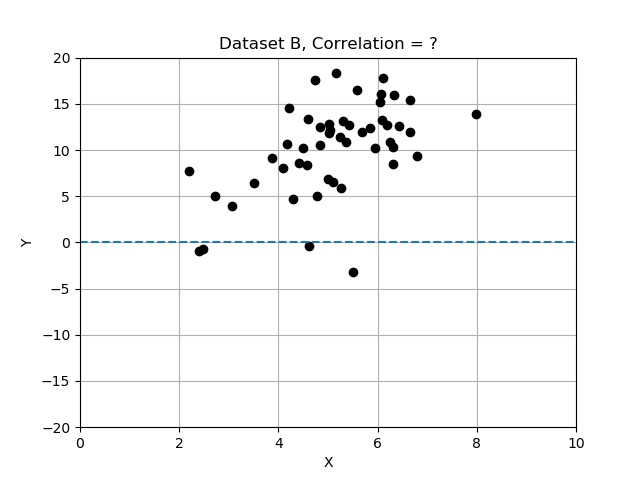
- Data Set B: there is a rough upward trend; x and y appear only loosely related.
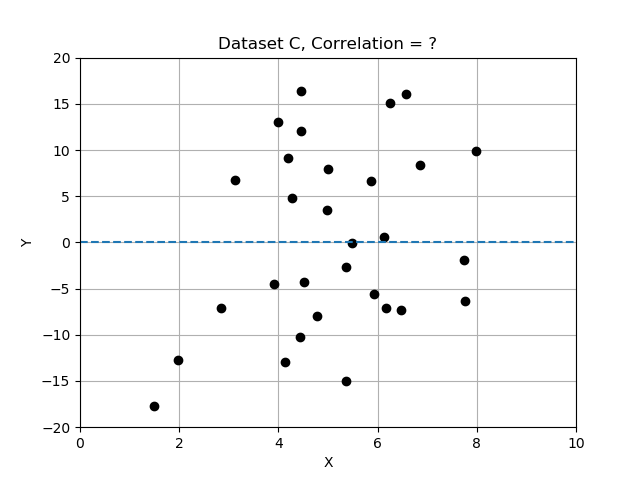
- Data Set C: looks like random scatter; x an y do not appear to change together and are unrelated.
Recall that deviations differ from the mean, and we normalized by dividing the deviations by standard deviation. In this exercise you will compare the 3 data sets by computing correlation, and determining which data set has the most strongly correlated variables x and y. Use the provided data table data_sets, a dictionary of records, each having keys 'name', 'x', 'y', and 'correlation'.
This exercise is part of the course
Introduction to Linear Modeling in Python
Exercise instructions
- Complete the function definition for
correlation()using the mean of the products of the normalized deviations ofxandy. - Iterate over
data_sets, computing and storing each correlation usingcorrelation(record['x'], record['y']). - Run the code up until this point (i.e. the end of the for loop), and inspect the printout. Which dataset has the strongest correlation?
- Assign the name of the dataset (
data_sets['A'],data_sets['B'], ordata_sets['C']) with the strongest correlation to the variablebest_data.
Hands-on interactive exercise
Have a go at this exercise by completing this sample code.
# Complete the function that will compute correlation.
def correlation(x,y):
    x_dev = x - np.____(x)
    y_dev = y - np.____(y)
    x_norm = x_dev / np.____(x)
    y_norm = y_dev / np.____(y)
    return np.____(x_norm * y_norm)

# Compute and store the correlation for each data set in the list.
for name, data in data_sets.items():
    data['correlation'] = ____(data['x'], data['y'])
    print('data set {} has correlation {:.2f}'.format(name, data['correlation']))

# Assign the data set with the best correlation.
best_data = data_sets['____']