Variation Around the Trend
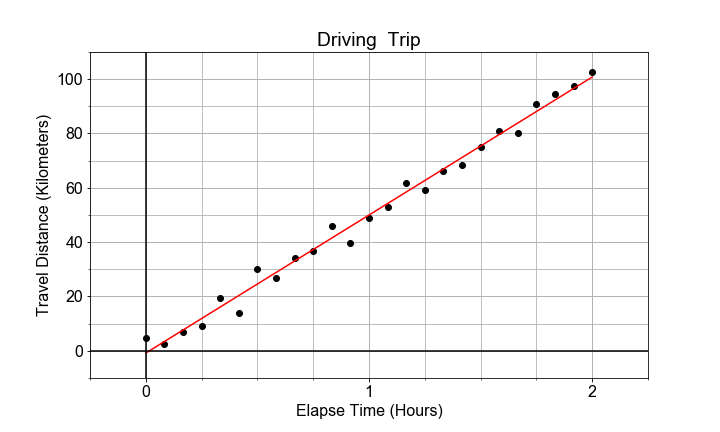
The data need not be perfectly linear, and there may be some random variation or "spread" in the measurements, and that does translate into variation of the model parameters. This variation is in the parameter is quantified by "standard error", and interpreted as "uncertainty" in the estimate of the model parameter.
In this exercise, you will use ols from statsmodels to build a model and extract the standard error for each parameter of that model.
This exercise is part of the course
Introduction to Linear Modeling in Python
Exercise instructions
- Store the preloaded data in a DataFrame
df, labelingx_dataastimesandy_dataasdistances. - Use
model_fit = ols().fit()to fit a linear model or the formformula="distances ~ times"to thedata=df. - Extract the estimated intercept
model_fit.params['Intercept']and the standard error of the slope frommodel_fit.bse['Intercept']. - Repeat for the slope, and then print all 4 with meaningful names.
Hands-on interactive exercise
Have a go at this exercise by completing this sample code.
# Store x_data and y_data, as times and distances, in df, and use ols() to fit a model to it.
df = pd.DataFrame(dict(____=x_data, ____=y_data))
model_fit = ols(____="distances ~ times", data=____).____()

# Extact the model parameters and their uncertainties
a0 = model_fit.____['Intercept']
e0 = model_fit.____['Intercept']
a1 = model_fit.____['times']
e1 = model_fit.____['times']

# Print the results with more meaningful names
print('Estimate    of the intercept = {:0.2f}'.format(____))
print('Uncertainty of the intercept = {:0.2f}'.format(____))
print('Estimate    of the slope = {:0.2f}'.format(____))
print('Uncertainty of the slope = {:0.2f}'.format(____))