Extrapolation: Going Over the Edge
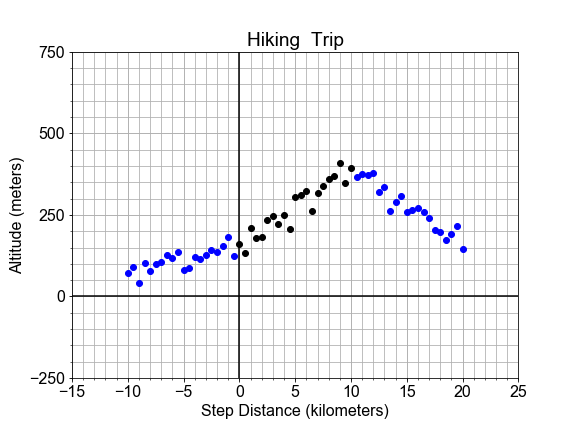
In this exercise, we consider the perils of extrapolation. Shown here is the profile of a hiking trail on a mountain. One portion of the trail, marked in black, looks linear, and was used to build a model. But we see that the best fit line, shown in red, does not fit outside the original "domain", as it extends into this new outside data, marked in blue.
If we want use the model to make predictions for the altitude, but still be accurate to within some tolerance, what are the smallest and largest values of independent variable x that we can allow ourselves to apply the model to?"
Here, use the preloaded x_data, y_data, y_model, and plot_data_model_tolerance() to complete your solution.
This exercise is part of the course
Introduction to Linear Modeling in Python
Exercise instructions
- Use
np.abs()to compute the residuals as the differencesy_data - y_model - Find the
.min()and.max()values ofxat which theresidualsare less than atolerance = 100meters. - Use
np.min() andnp.max()to print the range (the largest and smallest) ofx_good` values. - Use the predefined
plot_data_model_tolerance()to compare the data, model, and range ofx_goodvalues where theresiduals < toleranceisTrue.
Hands-on interactive exercise
Have a go at this exercise by completing this sample code.
# Compute the residuals, "data - model", and determine where [residuals < tolerance]
residuals = np.abs(____ - ____)
tolerance = 100
x_good = x_data[____ < ____]

# Find the min and max of the "good" values, and plot y_data, y_model, and the tolerance range
print('Minimum good x value = {}'.format(np.____(____)))
print('Maximum good x value = {}'.format(np.____(____)))
fig = plot_data_model_tolerance(x_data, y_data, y_model, tolerance)