Bootstrap and Standard Error
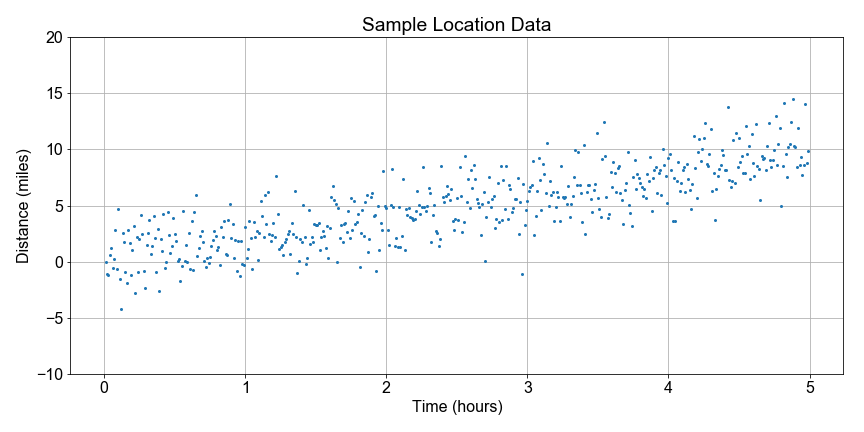
Imagine a National Park where park rangers hike each day as part of maintaining the park trails. They don't always take the same path, but they do record their final distance and time. We'd like to build a statistical model of the variations in daily distance traveled from a limited sample of data from one ranger.
Your goal is to use bootstrap resampling, computing one mean for each resample, to create a distribution of means, and then compute standard error as a way to quantify the "uncertainty" in the sample statistic as an estimator for the population statistic.
Use the preloaded sample_data array of 500 independent measurements of distance traveled. For now, we use a simulated data set to simplify this lesson. Later, we'll see more realistic data.
This exercise is part of the course
Introduction to Linear Modeling in Python
Exercise instructions
Assign the
sample_dataas the model for the population.Iterate
num_resamplestimes:- Use
np.random.choice()each time to generate abootstrap_sampleofsize=resample_sizetaken from thepopulation_modeland specifyreplace=True. - Compute and store the sample mean each time.
- Use
Compute and print the
np.mean()andnp.std()ofbootstrap_means.Use the predefined
plot_data_hist()and visualize thebootstrap_meansdistribution.
Hands-on interactive exercise
Have a go at this exercise by completing this sample code.
# Use the sample_data as a model for the population
population_model = ____

# Resample the population_model 100 times, computing the mean each sample
for nr in range(num_resamples):
    bootstrap_sample = np.random.____(population_model, size=____, replace=____)
    bootstrap_means[nr] = np.____(bootstrap_sample)

# Compute and print the mean, stdev of the resample distribution of means
distribution_mean = np.mean(____)
standard_error = np.std(____)
print('Bootstrap Distribution: center={:0.1f}, spread={:0.1f}'.format(____, ____))

# Plot the bootstrap resample distribution of means
fig = plot_data_hist(____)