Model Parameters
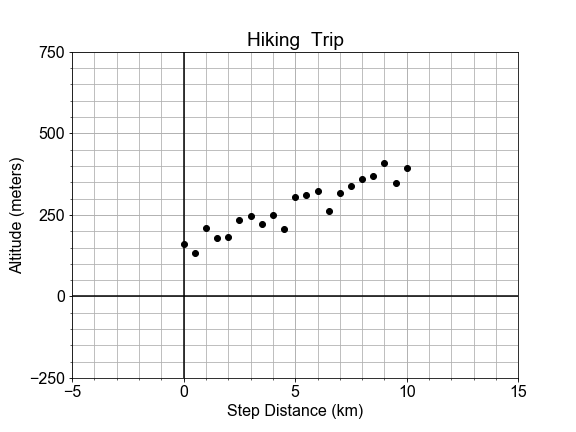
Now that you've built a general model, let's "optimize" or "fit" it to a new (preloaded) measured data set, xd, yd, by finding the specific values for model parameters a0, a1 for which the model data and the measured data line up on a plot.
This is an iterative visualization strategy, where we start with a guess for model parameters, pass them into the model(), over-plot the resulting modeled data on the measured data, and visually check that the line passes through the points. If it doesn't, we change the model parameters and try again.
This exercise is part of the course
Introduction to Linear Modeling in Python
Exercise instructions
- Complete the function
plot_data_and_model(xd, yd, ym), passingxd, ydandxd, yminto the internal plotting calls. - Compute model predictions using
ym = model()by passing in both the dataxdand the guessed model parametersa0anda1.- Inspect the data provided above, and use this as a guide when you provide your first two estimates. You can come back and revise these estimates after reviewing how the line fits the data.
- Use
plot_data_and_model()to plotxd,yd, andymtogether. - Change the values of
a0anda1and repeat the previous 2 steps until the line passes through all the points.
Hands-on interactive exercise
Have a go at this exercise by completing this sample code.
# Complete the plotting function definition
def plot_data_with_model(xd, yd, ym):
    fig = plot_data(____, ____)  # plot measured data
    fig.axes[0].plot(____, ____, color='red')  # over-plot modeled data
    plt.show()
    return fig

# Select new model parameters a0, a1, and generate modeled `ym` from them.
a0 = ____
a1 = ____
ym = model(xd, a0, a1)

# Plot the resulting model to see whether it fits the data
fig = plot_data_with_model(xd, yd, ____)