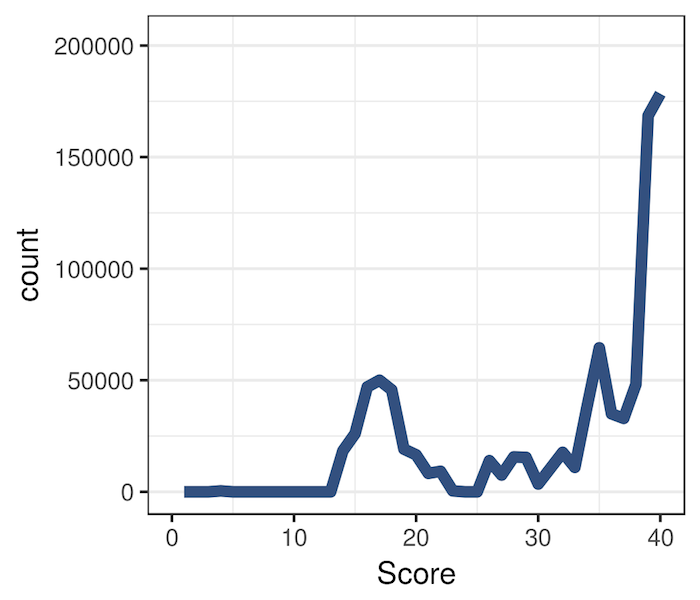
Basenqualitäts-Plot
Diese Abbildung wurde für dich aus den Basenqualitäts-Kodierungen einer kompletten fastq-Datei erstellt. Diese Datei verwendet die Illumina-Kodierung. Die maximale Kodierung ist I, entsprechend einem Score von 40. Gute Qualitätskodierungen haben Scores von 33 oder höher, sind also mit anderen Worten B oder höher.
Details zur Illumina-Kodierung findest du hier.
- Welche Scores sind in der Abbildung am stärksten vertreten?
Diese Übung ist Teil des Kurses
<Kurs>Einführung in Bioconductor in R</Kurs>Interaktive praktische Übung
Verwandle Theorie mit einer unserer interaktiven Übungen in die Praxis
 Übung starten