Bandingkan data yang telah difilter dengan pembacaan mentah
Mari kita cermati perbedaan yang dihasilkan oleh penyaringan pembacaan. Berikut adalah sebuah plot dengan tiga track cakupan yang berbeda. Dari atas ke bawah, masing-masing menunjukkan cakupan total, cakupan dari penjajaran berkualitas tinggi, dan cakupan dari penjajaran berkualitas rendah.
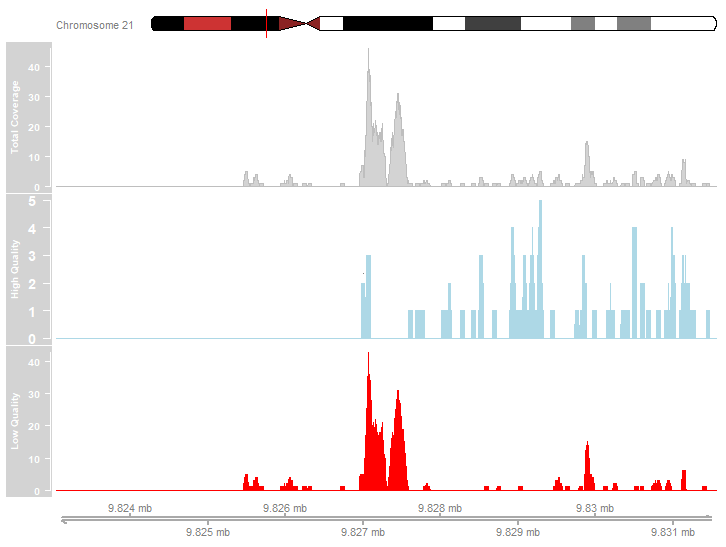
Amati plot di atas. Manakah dari pernyataan berikut yang secara akurat menggambarkan data cakupan yang ditampilkan?
- Sebagian besar penjajaran pembacaan berkualitas tinggi.
- Puncak yang paling menonjol disebabkan oleh penjajaran berkualitas rendah.
- Ada puncak pada profil cakupan berkualitas tinggi.
Latihan ini merupakan bagian dari kursus
ChIP-seq dengan Bioconductor di R
Latihan interaktif langsung
Ubah teori menjadi aksi dengan salah satu latihan interaktif kami
 Mulai latihan