Graphique de qualité par base
Cette figure a été créée pour vous à partir des encodages de qualité par base d’un fichier fastq complet. Ce fichier utilise l’encodage Illumina. L’encodage maximal est I, soit un score de 40. Les encodages de bonne qualité ont des scores de 33 ou plus, autrement dit B ou au‑dessus.
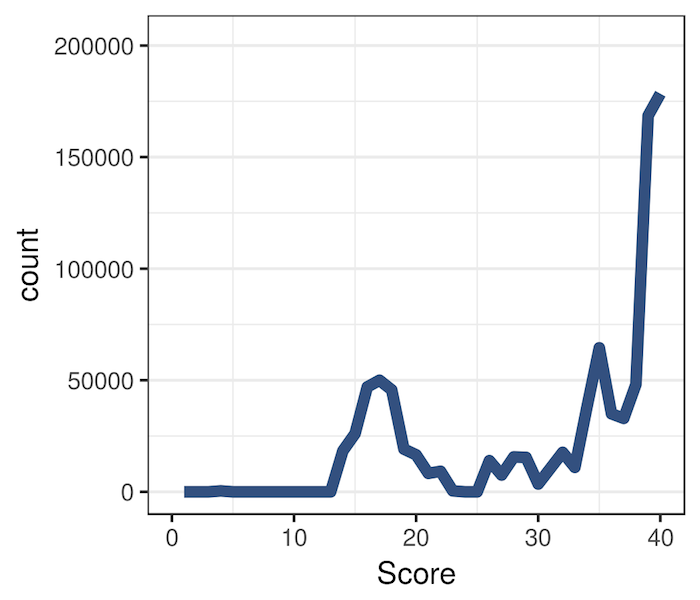
Vous trouverez des détails sur l’encodage Illumina ici.
- Quels scores sont les plus représentés sur la figure ?
Cet exercice fait partie du cours
<cours>Introduction à Bioconductor avec R</cours>Exercice interactif pratique
Transformez la théorie en action avec l’un de nos exercices interactifs
 Commencer l’exercice