內插:時間點之間的預測
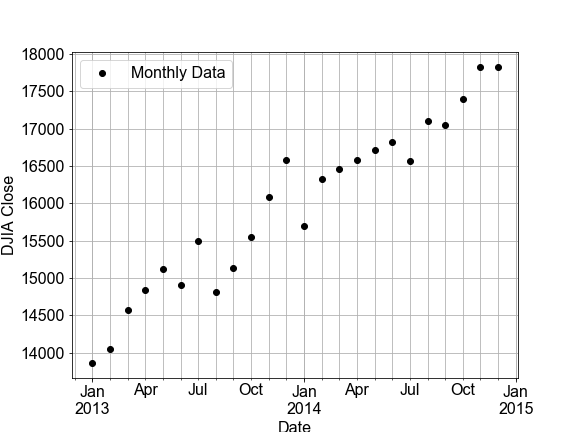
在這個練習中,你會先以道瓊工業指數(DJIA)的每月時間序列資料來擬合一個線性模型,接著用該模型對每日資料進行預測(也就是內插)。然後,你會把這個每日的預測與實際的每日 DJIA 資料做比較。
關於資料的幾點說明:「OHLC」代表「Open-High-Low-Close」,通常是每日資料,例如某股票在單日中的開盤價與收盤價,以及最高價與最低價。「DayCount」是從資料蒐集起點開始計算的整數天數。
本練習屬於課程
Python 線性建模入門
練習說明
- 使用
ols()搭配formula="Close ~ DayCount",在data=df_monthly上呼叫.fit()以擬合模型。 - 使用
model_fit.predict()針對df_monthly.DayCount與df_daily.DayCount進行預測,將每個 DataFrame 的預測Close價存成新欄位Model。 - 對
df_monthly與df_daily各呼叫一次預先定義好的plot_model_with_data,並比較所顯示的 RSS 值。
動手互動練習
試著完成這個範例程式碼,體驗一下這個練習。
# build and fit a model to the df_monthly data
model_fit = ols('Close ~ DayCount', ____=df_monthly).____()

# Use the model FIT to the MONTHLY data to make a predictions for both monthly and daily data
df_monthly['Model'] = model_fit.____(df_monthly.____)
df_daily['Model'] = model_fit.____(df_daily.____)

# Plot the monthly and daily data and model, compare the RSS values seen on the figures
fig_monthly = plot_model_with_data(____)
fig_daily = plot_model_with_data(____)