估計速度與信心區間
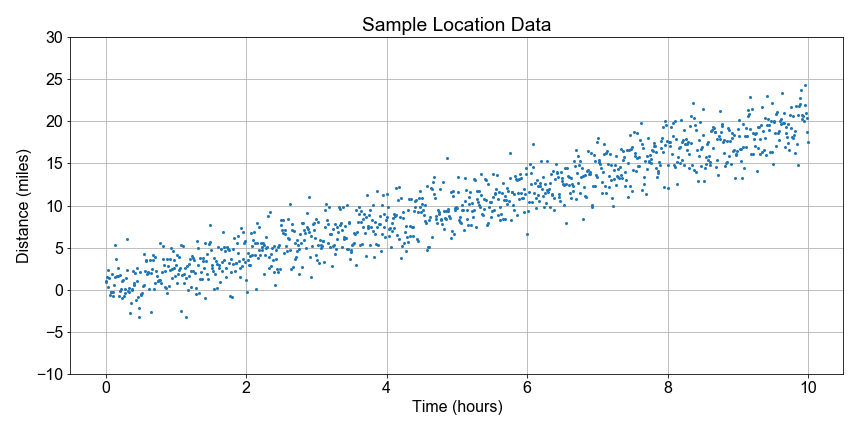
繼續看看國家公園健行的資料。注意有些距離是負值,因為他們是從登山口往相反方向走;資料有些雜亂,所以我們先著重在整體趨勢。
在這個練習中,你的目標是用自助法(bootstrap)重抽樣,求出線性模型的速度值分布;再從這個分布計算速度的最佳估計值,以及該估計的 90% 信賴區間。這裡的速度指的是線性迴歸模型中,用時間解釋距離時的斜率參數。
為了幫你上手,我們已經預先載入了 distance 與 time 資料,並提供了預先定義的 least_squares() 函式,讓你能為每次重抽樣計算速度值。
本練習屬於課程
Python 線性建模入門
練習說明
- 使用
np.random.choice()從population_inds抽取sample_inds,並保留每筆資料的距離與時間成對關係。 - 為了保留時間順序,先對
sample_inds使用.sort(),再用sample_inds來索引distances與times。 - 使用
least_squares(times, distances)計算線性模型參數,將a1存入resample_speeds。 - 對
resample_speeds套用np.mean()與np.percentiles(),計算速度與信賴區間ci_90,並印出兩者。
動手互動練習
試著完成這個範例程式碼,體驗一下這個練習。
# Resample each preloaded population, and compute speed distribution
population_inds = np.arange(0, 99, dtype=int)
for nr in range(num_resamples):
    sample_inds = np.random.choice(____, size=100, replace=True)
    sample_inds.____()
    sample_distances = distances[____]
    sample_times = times[____]
    a0, a1 = ____(sample_times, sample_distances)
    resample_speeds[nr] = ____

# Compute effect size and confidence interval, and print
speed_estimate = np.mean(____)
ci_90 = np.percentile(____, [5, 95])
print('Speed Estimate = {:0.2f}, 90% Confidence Interval: {:0.2f}, {:0.2f} '.format(____, ____[0], ____[1]))