趨勢周圍的變異
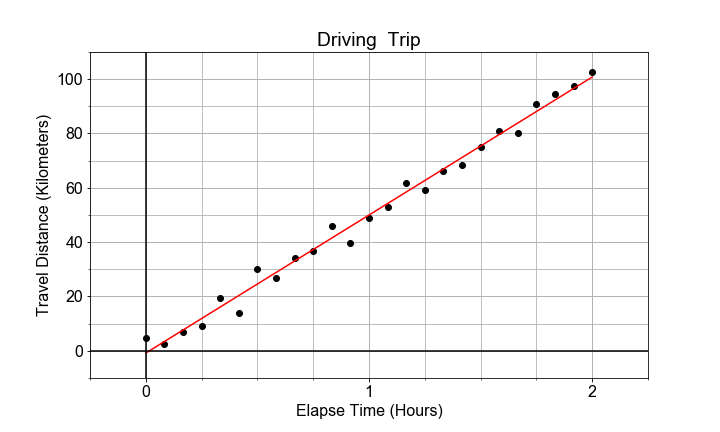
資料不一定是完全線性的,量測中可能會有隨機變動或「分散」,而這會反映到模型參數的變動。這種參數的變動量以「標準誤」量化,並可解讀為對模型參數估計的「不確定性」。
在這個練習中,你會使用 statsmodels 的 ols 建立模型,並擷取該模型中每個參數的標準誤。
本練習屬於課程
Python 線性建模入門
練習說明
- 將預先載入的資料存成 DataFrame
df,把x_data標記為times,y_data標記為distances。 - 使用
model_fit = ols().fit()來對data=df擬合形式為formula="distances ~ times"的線性模型。 - 取出估計的截距
model_fit.params['Intercept'],以及從model_fit.bse['Intercept']取得截距的標準誤。 - 對斜率也做相同動作,然後用有意義的名稱列印這 4 個數值。
動手互動練習
試著完成這個範例程式碼,體驗一下這個練習。
# Store x_data and y_data, as times and distances, in df, and use ols() to fit a model to it.
df = pd.DataFrame(dict(____=x_data, ____=y_data))
model_fit = ols(____="distances ~ times", data=____).____()

# Extact the model parameters and their uncertainties
a0 = model_fit.____['Intercept']
e0 = model_fit.____['Intercept']
a1 = model_fit.____['times']
e1 = model_fit.____['times']

# Print the results with more meaningful names
print('Estimate    of the intercept = {:0.2f}'.format(____))
print('Uncertainty of the intercept = {:0.2f}'.format(____))
print('Estimate    of the slope = {:0.2f}'.format(____))
print('Uncertainty of the slope = {:0.2f}'.format(____))