R 平方
先前我們用另一個擬合優度指標 R 平方(R-squared),把它表為 RSS 與 VAR 的比值。對這個比值的分子與分母同時乘上 1/n,即可得到數值上等價的形式:也就是殘差的變異數,除以我們所建模資料中線性趨勢的變異數。這可解讀為:你的模型「解釋」了資料中多少變異,與殘差的擴散或變異(也就是移除線性趨勢之後所剩的變異)相對。
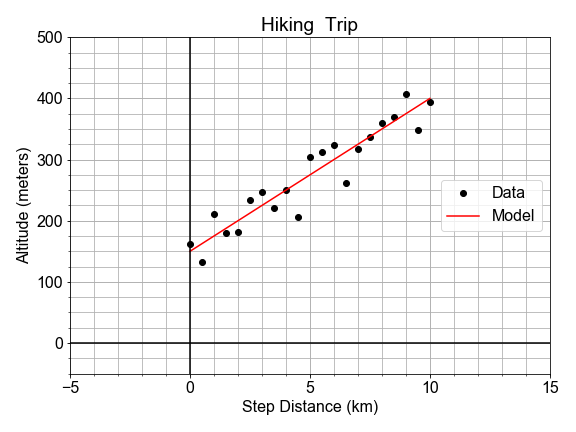
這裡我們已經預先載入 x_data、y_data,以及最適模型的預測 y_model。你的目標是計算 R 平方,以量化這個線性模型能解釋資料變異的程度。
本練習屬於課程
Python 線性建模入門
練習說明
- 計算
residuals:以y_model減去y_data;以及計算deviations:以y_data的np.mean()減去y_data。 - 使用
np.mean()與np.square()分別計算residuals的變異數與deviations的變異數。 - 計算
r_squared為 1 減去比值var_residuals / var_deviations,並印出結果。
動手互動練習
試著完成這個範例程式碼,體驗一下這個練習。
# Compute the residuals and the deviations
residuals = ____ - y_data
deviations = np.____(____) - y_data

# Compute the variance of the residuals and deviations
var_residuals = np.____(np.____(____))
var_deviations = np.____(np.____(____))

# Compute r_squared as 1 - the ratio of RSS/Variance
r_squared = 1 - (____ / ____)
print('R-squared is {:0.2f}'.format(____))