模型參數
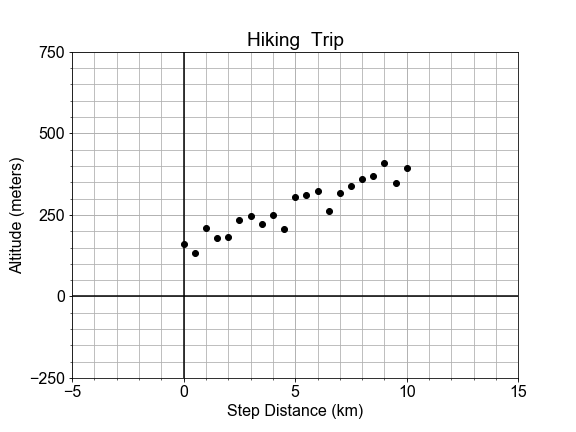
既然你已經建立了一個「一般化」的模型,現在來把它「最佳化」或「擬合」到一組新的(已預先載入的)量測資料 xd, yd。方法是找出模型參數 a0, a1 的「特定」數值,讓模型產生的資料與量測資料在圖上對齊。
這是一種反覆的視覺化策略:先對模型參數做一個「猜測」,把它們傳入 model(),再把模型產生的資料疊繪在量測資料上,並用肉眼檢查直線是否穿過這些點。若沒有,就調整模型參數再試一次。
本練習屬於課程
Python 線性建模入門
練習說明
- 完成函式
plot_data_and_model(xd, yd, ym),在內部的繪圖呼叫中傳入xd, yd與xd, ym。 - 使用
ym = model()計算模型預測,並同時傳入資料xd以及你猜測的模型參數a0和a1。- 先檢視上方提供的資料,並以此作為前兩個估計值的依據。檢視直線如何貼合資料後,你可以再回來修正這些估計值。
- 使用
plot_data_and_model()將xd、yd與ym一起繪製。 - 變更
a0與a1的數值,重複前兩個步驟,直到直線通過所有點為止。
動手互動練習
試著完成這個範例程式碼,體驗一下這個練習。
# Complete the plotting function definition
def plot_data_with_model(xd, yd, ym):
    fig = plot_data(____, ____)  # plot measured data
    fig.axes[0].plot(____, ____, color='red')  # over-plot modeled data
    plt.show()
    return fig

# Select new model parameters a0, a1, and generate modeled `ym` from them.
a0 = ____
a1 = ____
ym = model(xd, a0, a1)

# Plot the resulting model to see whether it fits the data
fig = plot_data_with_model(xd, yd, ____)