Bootstrap 與標準誤
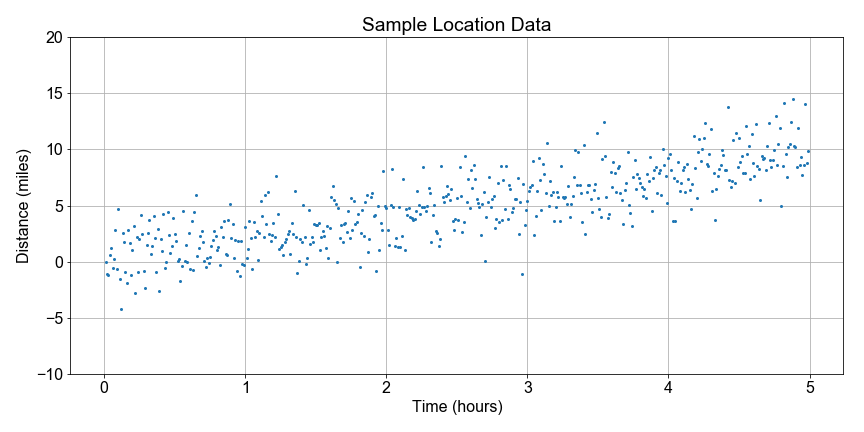
想像在一座國家公園裡,護管員每天都會為了維護步道而健行。他們不一定走同一條路線,但會記錄當天的總距離與時間。我們想用一位護管員的有限樣本資料,建立每日行走距離變化的統計模型。
你的目標是使用自助式重抽樣(bootstrap resampling),對每個重抽樣各計算一次平均數,形成平均數的分佈,接著計算標準誤,作為量化「不確定性」的方法,用來評估「樣本統計量」作為「母體統計量」估計值的可信度。
使用已預先載入的 sample_data,其中包含 500 筆彼此獨立的行走距離量測。為了簡化本節內容,我們先使用模擬資料集。之後你會看到更貼近真實情況的資料。
本練習屬於課程
Python 線性建模入門
練習說明
將
sample_data指定為母體的模型。迭代執行
num_resamples次:- 每次使用
np.random.choice()從population_model產生一個大小為resample_size的bootstrap_sample,並指定replace=True。 - 每次計算並儲存該樣本的平均數。
- 每次使用
計算並列印
bootstrap_means的np.mean()與np.std()。使用預先定義的
plot_data_hist(),將bootstrap_means的分佈視覺化。
動手互動練習
試著完成這個範例程式碼,體驗一下這個練習。
# Use the sample_data as a model for the population
population_model = ____

# Resample the population_model 100 times, computing the mean each sample
for nr in range(num_resamples):
    bootstrap_sample = np.random.____(population_model, size=____, replace=____)
    bootstrap_means[nr] = np.____(bootstrap_sample)

# Compute and print the mean, stdev of the resample distribution of means
distribution_mean = np.mean(____)
standard_error = np.std(____)
print('Bootstrap Distribution: center={:0.1f}, spread={:0.1f}'.format(____, ____))

# Plot the bootstrap resample distribution of means
fig = plot_data_hist(____)