兩部分的變異
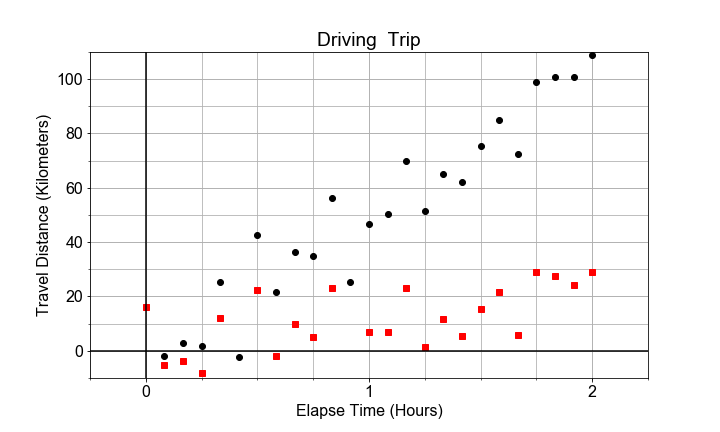
給定兩組距離對時間的資料,其中一組速度非常小,另一組速度很大。請注意,兩者的斜率標準誤可能相同,但整體模型的 R-squared 會不同;這取決於斜率大小(「效果量」)相對於標準誤(「不確定性」)的比例。
如果把兩組資料畫在同一組座標軸上的散佈圖,對比會很明顯。斜率造成的變異與沿著趨勢線隨機散佈造成的變異是不同的。在本練習中,你的目標是計算兩組資料的斜率標準誤與 R-squared,並加以比較。
本練習屬於課程
Python 線性建模入門
練習說明
- 針對兩組資料
distances1與distances2建立並fit()一個ols()模型。 - 使用得到的模型
model_1與model_2的.bse,並以'times'作為鍵,從各模型擷取斜率的標準誤。 - 使用
.rsquared屬性,從各模型擷取 R-squared 值。 - 印出
se_1、rsquared_1、se_2、rsquared_2,並進行視覺比較。
動手互動練習
試著完成這個範例程式碼,體驗一下這個練習。
# Build and fit two models, for columns distances1 and distances2 in df
model_1 = ols(formula="____ ~ times", data=df).____()
model_2 = ols(formula="____ ~ times", data=df).____()

# Extract R-squared for each model, and the standard error for each slope
se_1 = model_1.____['times']
se_2 = model_2.____['times']
rsquared_1 = model_1.____
rsquared_2 = model_2.____

# Print the results
print('Model 1: SE = {:0.3f}, R-squared = {:0.3f}'.format(____, ____))
print('Model 2: SE = {:0.3f}, R-squared = {:0.3f}'.format(____, ____))