補間:そのあいだの時点
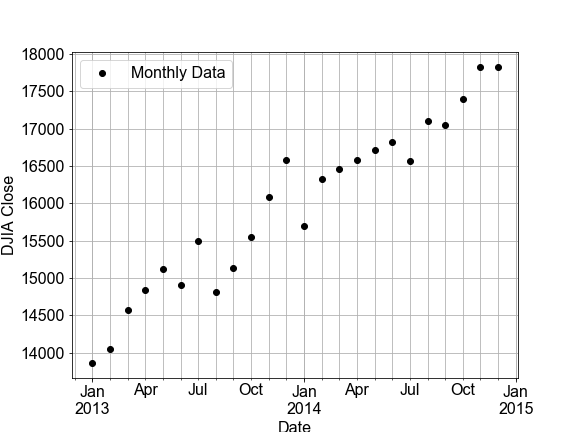
この演習では、まずダウ工業株30種平均(DJIA)の月次時系列データに線形モデルを当てはめ、次にそのモデルを使って日次データを予測します(いわば補間です)。そのうえで、日次の予測値を実際の日次DJIAデータと比較します。
データに関する補足です。"OHLC" は "Open-High-Low-Close"(始値・高値・安値・終値)の略で、通常は日次データを指します。たとえば、ある日の株式の始値と終値、最高値と最安値です。"DayCount" はデータ収集開始日からの日数を表す整数です。
この演習はコースの一部です
Pythonで学ぶ線形モデリング入門
演習の手順
ols()を使って、formula="Close ~ DayCount"、data=df_monthlyのモデルを.fit()してください。model_fit.predict()をdf_monthly.DayCountとdf_daily.DayCountの両方に適用し、月次と日次のClose価格の予測値をそれぞれの DataFrame に新しいカラムModelとして保存します。- 事前定義済みの
plot_model_with_dataをdf_monthlyとdf_dailyのそれぞれに対して実行し、表示される RSS を比較してください。
実践的なインタラクティブ演習
このサンプルコードを完成させて、この演習に挑戦してみましょう。
# build and fit a model to the df_monthly data
model_fit = ols('Close ~ DayCount', ____=df_monthly).____()

# Use the model FIT to the MONTHLY data to make a predictions for both monthly and daily data
df_monthly['Model'] = model_fit.____(df_monthly.____)
df_daily['Model'] = model_fit.____(df_daily.____)

# Plot the monthly and daily data and model, compare the RSS values seen on the figures
fig_monthly = plot_model_with_data(____)
fig_daily = plot_model_with_data(____)