トレンド周りのばらつき
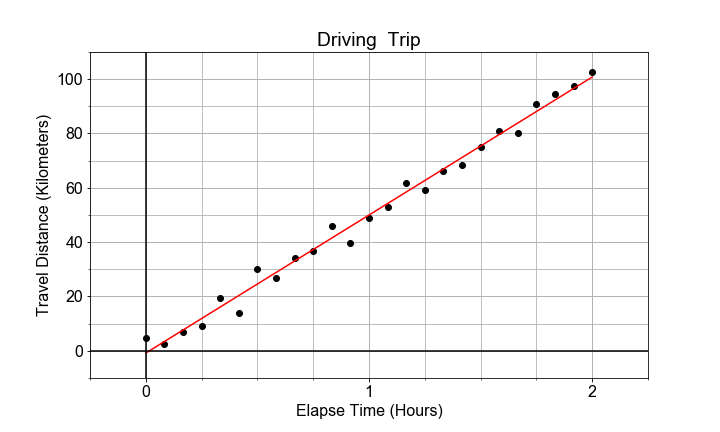
データは必ずしも完全に線形とは限らず、測定値にはランダムなばらつき(スプレッド)が生じることがあります。これはモデルのパラメータのばらつきにもつながります。パラメータのばらつきは「標準誤差」で定量化され、モデルパラメータ推定の「不確かさ」として解釈されます。
この演習では、statsmodels の ols を使ってモデルを構築し、そのモデルの各パラメータに対する標準誤差を取り出します。
この演習はコースの一部です
Pythonで学ぶ線形モデリング入門
演習の手順
- 事前読み込み済みのデータを DataFrame
dfに格納し、x_dataをtimes、y_dataをdistancesという列名にします。 model_fit = ols().fit()を使い、data=dfに対してformula="distances ~ times"の形の線形モデルを当てはめます。- 推定された切片を
model_fit.params['Intercept']から、切片の標準誤差をmodel_fit.bse['Intercept']から取り出します。 - 傾きについても同様に取り出し、意味の伝わる名前で4つすべてを出力してください。
実践的なインタラクティブ演習
このサンプルコードを完成させて、この演習に挑戦してみましょう。
# Store x_data and y_data, as times and distances, in df, and use ols() to fit a model to it.
df = pd.DataFrame(dict(____=x_data, ____=y_data))
model_fit = ols(____="distances ~ times", data=____).____()

# Extact the model parameters and their uncertainties
a0 = model_fit.____['Intercept']
e0 = model_fit.____['Intercept']
a1 = model_fit.____['times']
e1 = model_fit.____['times']

# Print the results with more meaningful names
print('Estimate    of the intercept = {:0.2f}'.format(____))
print('Uncertainty of the intercept = {:0.2f}'.format(____))
print('Estimate    of the slope = {:0.2f}'.format(____))
print('Uncertainty of the slope = {:0.2f}'.format(____))