ブートストラップと標準誤差
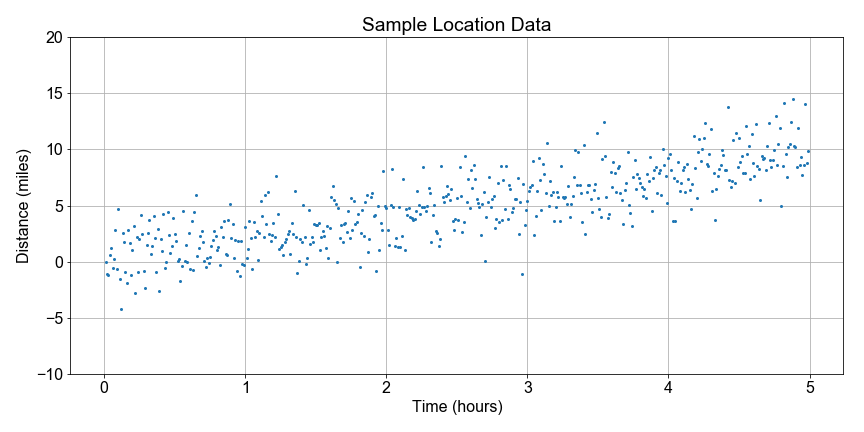
国立公園では、レンジャーが毎日トレイル整備の一環としてハイキングをします。毎回同じルートではありませんが、最終的な移動距離と所要時間は記録しています。ここでは、ある1人のレンジャーから得られた限られた標本データを使って、日々の移動距離のばらつきを統計モデル化したいと考えます。
あなたの目標は、ブートストラップ再標本化を用いて、各再標本ごとに平均を1つ計算し、その平均の分布を作ることです。次に、その分布から標準誤差を計算し、母集団統計量の推定量としての標本統計量に含まれる「不確実性」を定量化します。
あらかじめ読み込まれている sample_data 配列には、移動距離の独立な測定値が500件含まれています。今回はレッスンを簡潔にするためにシミュレートしたデータを使います。後ほど、より現実的なデータも見ていきます。
この演習はコースの一部です
Pythonで学ぶ線形モデリング入門
演習の手順
sample_dataを母集団のモデルとしてpopulation_modelに代入します。num_resamples回ループして、次を行います:- 毎回
np.random.choice()を使い、population_modelからsize=resample_size、replace=Trueを指定してbootstrap_sampleを生成します。 - 毎回、標本平均を計算して保存します。
- 毎回
bootstrap_meansに対してnp.mean()とnp.std()を計算して表示します。事前定義の
plot_data_hist()を使って、bootstrap_meansの分布を可視化します。
実践的なインタラクティブ演習
このサンプルコードを完成させて、この演習に挑戦してみましょう。
# Use the sample_data as a model for the population
population_model = ____

# Resample the population_model 100 times, computing the mean each sample
for nr in range(num_resamples):
    bootstrap_sample = np.random.____(population_model, size=____, replace=____)
    bootstrap_means[nr] = np.____(bootstrap_sample)

# Compute and print the mean, stdev of the resample distribution of means
distribution_mean = np.mean(____)
standard_error = np.std(____)
print('Bootstrap Distribution: center={:0.1f}, spread={:0.1f}'.format(____, ____))

# Plot the bootstrap resample distribution of means
fig = plot_data_hist(____)