Influence de l’a priori et des données sur l’a posteriori
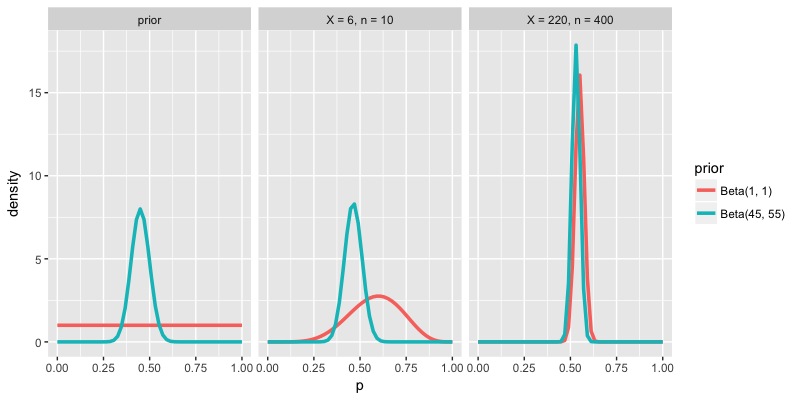
Examinez les tracés de densité ci-dessous. Le premier ensemble illustre deux a priori possibles pour votre soutien sous-jacent \(p\). Les deux autres ensembles montrent les modèles a posteriori pour \(p\) qui résultent de ces a priori différents et de données de sondage \(X\) et \(n\) différentes. Laquelle des propositions suivantes décrit le mieux l’influence combinée de l’a priori et des données sur l’a posteriori ?
Cet exercice fait partie du cours
<cours>Modélisation bayésienne avec RJAGS</cours>Exercice interactif pratique
Transformez la théorie en action avec l’un de nos exercices interactifs
 Commencer l’exercice