Brecha salarial
El siguiente gráfico muestra la distribución de la compensación para empleados Active e Inactive en los niveles Analyst y Specialist.
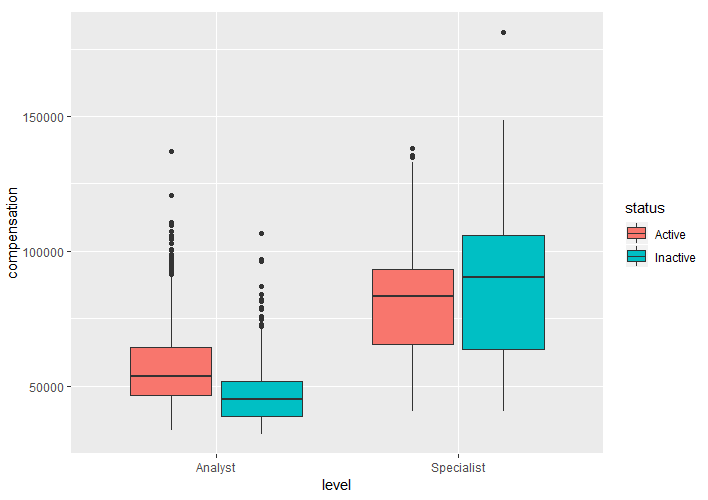
Revisa el gráfico y selecciona la opción correcta a continuación:
Este ejercicio forma parte del curso
Analítica de RR. HH.: Predicción de la rotación de empleados en R
ejercicio interactivo práctico
Convierte la teoría en práctica con uno de nuestros ejercicios interactivos
 Empezar ejercicio