Extrapolation: über den Rand hinausgehen
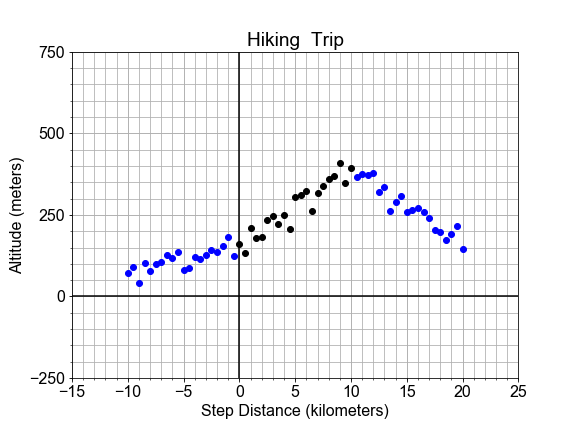
In dieser Übung schauen wir uns die Risiken der Extrapolation an. Hier siehst du das Profil eines Wanderwegs auf einem Berg. Ein Abschnitt des Wegs, schwarz markiert, wirkt linear und wurde verwendet, um ein Modell zu erstellen. Wir sehen aber, dass die Ausgleichsgerade, rot dargestellt, außerhalb des ursprünglichen „Definitionsbereichs“ nicht passt, da sie in neue, außerhalb liegende Daten (blau markiert) hineinragt.
Wenn wir das Modell verwenden möchten, um die Höhe vorherzusagen, dabei aber innerhalb einer bestimmten Toleranz genau bleiben wollen: Was sind die kleinsten und größten Werte der unabhängigen Variablen x, für die wir das Modell anwenden können?
Verwende hierzu die vorab geladenen Variablen x_data, y_data, y_model sowie plot_data_model_tolerance(), um deine Lösung zu vervollständigen.
Diese Übung ist Teil des Kurses
<Kurs>Einführung in lineares Modellieren mit Python</Kurs>Übungsanweisungen
- Verwende
np.abs(), um die Residuen als Differenzeny_data - y_modelzu berechnen. - Ermittle die
.min()- und.max()-Werte vonx, bei denen dieresidualskleiner sind als einetolerance = 100Meter. - Verwende
np.min()undnp.max(), um den Bereich (die größten und kleinsten) derx_good-Werte auszugeben. - Nutze die vordefinierte Funktion
plot_data_model_tolerance(), um Daten, Modell und den Bereich derx_good-Werte zu vergleichen, bei denenresiduals < toleranceTrueist.
Interaktive praktische Übung
Versuche dich an dieser Übung, indem du diesen Beispielcode vervollständigst.
# Compute the residuals, "data - model", and determine where [residuals < tolerance]
residuals = np.abs(____ - ____)
tolerance = 100
x_good = x_data[____ < ____]

# Find the min and max of the "good" values, and plot y_data, y_model, and the tolerance range
print('Minimum good x value = {}'.format(np.____(____)))
print('Maximum good x value = {}'.format(np.____(____)))
fig = plot_data_model_tolerance(x_data, y_data, y_model, tolerance)