Stichprobenstatistik versus Grundgesamtheit
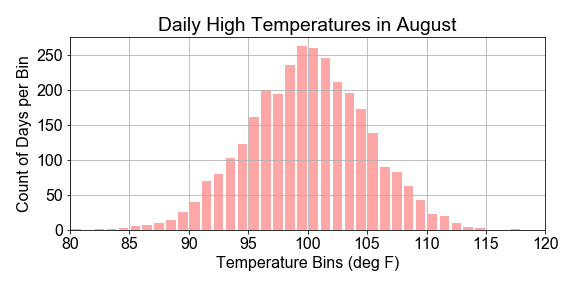
In dieser Übung arbeitest du mit einer vorab geladenen population. Du konstruierst eine sample, indem du zufällig Punkte aus der Grundgesamtheit ziehst. Du berechnest den Mittelwert und die Standardabweichung der aus dieser Grundgesamtheit gezogenen Stichprobe, um zu prüfen, ob die Stichprobe die Grundgesamtheit repräsentiert. Dein Ziel ist zu sehen, ob die Stichprobenstatistiken identisch oder sehr nahe an den Statistiken der Grundgesamtheit liegen.
Diese Übung ist Teil des Kurses
<Kurs>Einführung in lineares Modellieren mit Python</Kurs>Übungsanweisungen
- Berechne und gib den Mittelwert und die Standardabweichung der
population-Daten aus. - Verwende
np.random.seed(), um den Seed des Pseudozufallszahlengenerators vonnumpyauf42zu setzen. - Verwende
np.random.choice(), um einesampledersize=31zu erstellen, wobeisizedie Anzahl der aus derpopulationgezogenen Punkte ist. - Berechne und gib den Mittelwert und die Standardabweichung der
sampleaus und vergleiche die ausgegebenen Werte der Stichproben- und Grundgesamtheitsstatistiken, um zu sehen, ob sie sich unterscheiden.
Interaktive praktische Übung
Versuche dich an dieser Übung, indem du diesen Beispielcode vervollständigst.
# Compute the population statistics
print("Population mean {:.1f}, stdev {:.2f}".format( population.____(), population.____() ))

# Set random seed for reproducibility
____.____.____(42)

# Construct a sample by randomly sampling 31 points from the population
sample = np.____.____(____, size=31)

# Compare sample statistics to the population statistics
print("    Sample mean {:.1f}, stdev {:.2f}".format( sample.____(), sample.____() ))