Daten plotten
In python ist alles ein Objekt – sogar Module. In dieser Übung sollst du die objektorientierte Schnittstelle der python-Bibliothek matplotlib auffrischen, um Messdaten in einem flexibleren und besser erweiterbaren Workflow zu visualisieren. Der allgemeine Plot-Workflow sieht so aus:
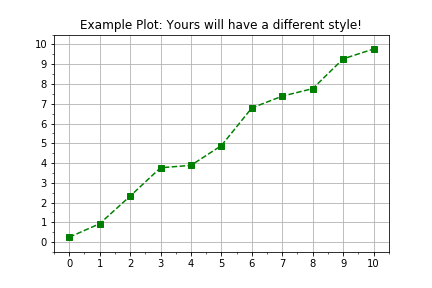
import matplotlib.pyplot as plt
fig, axis = plt.subplots()
axis.plot(x, y, color="green", linestyle="--", marker="s")
plt.show()
Diese Übung ist Teil des Kurses
<Kurs>Einführung in lineares Modellieren mit Python</Kurs>Übungsanweisungen
- Verwende
plt.subplots(), um figure- und axis-Objekte zu erstellen. - Die Daten liegen in zwei vordefinierten
numpy-Arraystimesunddistancesvor. - Verwende
axis.plot(), umtimesauf der horizontalen unddistancesauf der vertikalen Achse zu plotten. - Nutze beim Aufruf von
axis.plot()die Keyword-Argumentelinestyle=" ",marker="o"undcolor="red".
Interaktive praktische Übung
Versuche dich an dieser Übung, indem du diesen Beispielcode vervollständigst.
# Create figure and axis objects using subplots()
fig, axis = plt.____()

# Plot line using the axis.plot() method
line = axis.plot(____ , ____ , linestyle="____", marker="____", color="____")

# Use the plt.show() method to display the figure
plt.____()