Geschwindigkeit und Konfidenz schätzen
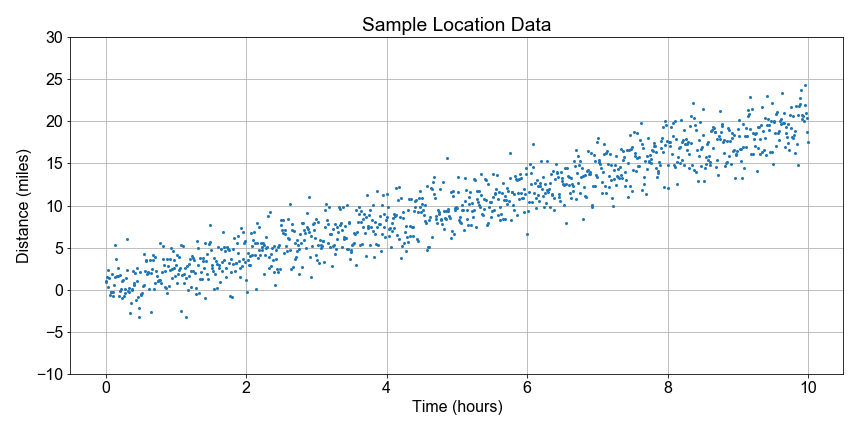
Schauen wir uns weiter die Wanderdaten aus dem Nationalpark an. Manche Distanzen sind negativ, weil in die entgegengesetzte Richtung vom Startpunkt gelaufen wurde; die Daten sind also unaufgeräumt, deshalb konzentrieren wir uns auf den generellen Trend.
In dieser Übung sollst du mit Bootstrap-Resampling die Verteilung der Geschwindigkeitswerte für ein lineares Modell bestimmen und daraus die beste Schätzung für die Geschwindigkeit sowie das 90-%-Konfidenzintervall dieser Schätzung berechnen. Die Geschwindigkeit ist hier der Steigungsparameter aus dem linearen Regressionsmodell, das die Distanz als Funktion der Zeit anpasst.
Zum Starten haben wir distance- und time-Daten vorab geladen sowie eine vordefinierte Funktion least_squares(), mit der für jedes Resample der Geschwindigkeitswert berechnet wird.
Diese Übung ist Teil des Kurses
<Kurs>Einführung in lineares Modellieren mit Python</Kurs>Übungsanweisungen
- Verwende
np.random.choice(), umsample_indsauspopulation_indszu ziehen, und erhalte dabei die Paarung von Distanz und Zeit für jedes Datum. - Um die Zeitreihenfolge zu erhalten,
.sort()diesample_indsund verwende dannsample_inds, umdistancesundtimeszu indizieren. - Nutze
least_squares(times, distances), um die Parameter des linearen Modells zu berechnen, und speicherea1inresample_speeds. - Wende
np.mean()undnp.percentiles()aufresample_speedsan, berechne die Geschwindigkeit und das Konfidenzintervallci_90und gib beides aus.
Interaktive praktische Übung
Versuche dich an dieser Übung, indem du diesen Beispielcode vervollständigst.
# Resample each preloaded population, and compute speed distribution
population_inds = np.arange(0, 99, dtype=int)
for nr in range(num_resamples):
    sample_inds = np.random.choice(____, size=100, replace=True)
    sample_inds.____()
    sample_distances = distances[____]
    sample_times = times[____]
    a0, a1 = ____(sample_times, sample_distances)
    resample_speeds[nr] = ____

# Compute effect size and confidence interval, and print
speed_estimate = np.mean(____)
ci_90 = np.percentile(____, [5, 95])
print('Speed Estimate = {:0.2f}, 90% Confidence Interval: {:0.2f}, {:0.2f} '.format(____, ____[0], ____[1]))