Interpolation: Zwischenzeiten
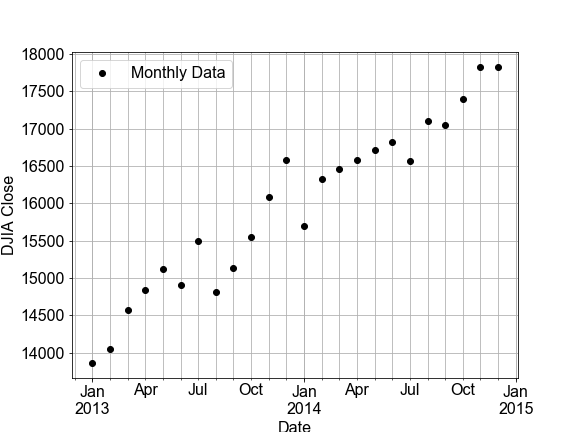
In dieser Übung passt du ein lineares Modell an monatliche Zeitreihendaten des Dow Jones Industrial Average (DJIA) an und verwendest dieses Modell anschließend, um Vorhersagen für tägliche Daten zu treffen (eine Interpolation). Danach vergleichst du diese täglichen Vorhersagen mit den realen täglichen DJIA-Daten.
Ein paar Hinweise zu den Daten: „OHLC“ steht für „Open-High-Low-Close“ und bezeichnet in der Regel tägliche Daten, also z. B. Eröffnungs- und Schlusskurse sowie Höchst- und Tiefstkurse einer Aktie an einem bestimmten Tag. „DayCount“ ist die Anzahl der Tage (als ganze Zahl) seit Beginn der Datenerhebung.
Diese Übung ist Teil des Kurses
<Kurs>Einführung in lineares Modellieren mit Python</Kurs>Übungsanweisungen
- Verwende
ols()und.fit(), um mitdata=df_monthlyundformula="Close ~ DayCount"ein Modell zu fitten. - Nutze
model_fit.predict()sowohl aufdf_monthly.DayCountals auch aufdf_daily.DayCount, um Werte für die monatlichen und täglichenClose-Preise vorherzusagen, und speichere sie als neue SpalteModelin jedem DataFrame. - Verwende die vordefinierte Funktion
plot_model_with_datazweimal, jeweils fürdf_monthlyunddf_daily, und vergleiche die angezeigten RSS-Werte.
Interaktive praktische Übung
Versuche dich an dieser Übung, indem du diesen Beispielcode vervollständigst.
# build and fit a model to the df_monthly data
model_fit = ols('Close ~ DayCount', ____=df_monthly).____()

# Use the model FIT to the MONTHLY data to make a predictions for both monthly and daily data
df_monthly['Model'] = model_fit.____(df_monthly.____)
df_daily['Model'] = model_fit.____(df_daily.____)

# Plot the monthly and daily data and model, compare the RSS values seen on the figures
fig_monthly = plot_model_with_data(____)
fig_daily = plot_model_with_data(____)