Écart de rémunération
Le graphique ci-dessous montre la distribution de la rémunération des employés Active et Inactive aux niveaux Analyst et Specialist.
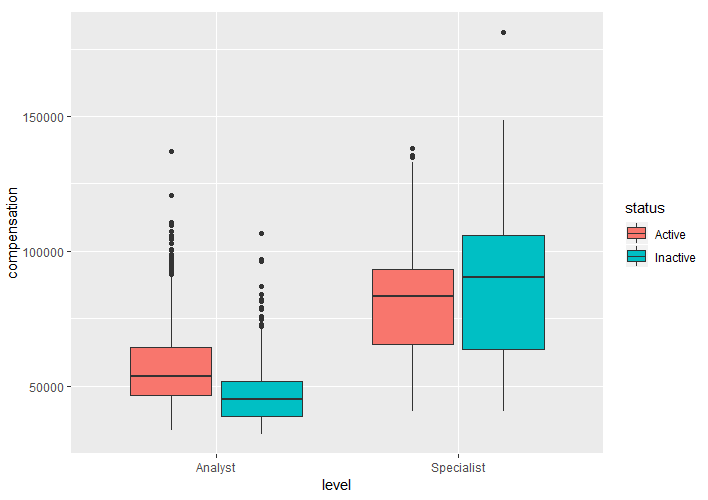
Analysez le graphique et sélectionnez l’option correcte ci-dessous :
Cet exercice fait partie du cours
<cours>Analytique RH : prédire l’attrition des employés en R</cours>Exercice interactif pratique
Transformez la théorie en action avec l’un de nos exercices interactifs
 Commencer l’exercice