Selon vous, ces échantillons se ressemblent-ils ?
Examiner des graphiques de PCA permet d’évaluer, à l’échelle globale, les similarités et différences entre échantillons. À partir des résultats générés lors du contrôle qualité des échantillons, il est simple de produire des graphiques de PCA sur les données traitées. Ci-dessous, vous trouverez un graphique pour les quatre échantillons ayant passé le contrôle qualité.
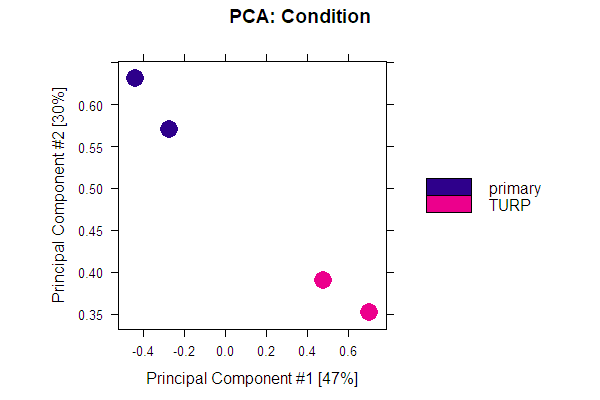
Analysez le graphique, puis réfléchissez aux affirmations suivantes. Lesquelles sont vraies ?
- Les échantillons se regroupent par condition.
- Un graphique comme celui-ci peut être créé avec la fonction
plotPrincomp(). - Avec un graphique de PCA, il est facile de voir quels pics diffèrent le plus entre groupes.
Cet exercice fait partie du cours
<cours>ChIP-seq avec Bioconductor en R</cours>Exercice interactif pratique
Transformez la théorie en action avec l’un de nos exercices interactifs
 Commencer l’exercice