Plot kualitas basa
Gambar ini telah dibuat untuk Anda dari pengkodean kualitas basa dari seluruh berkas fastq. Berkas ini menggunakan pengkodean Illumina. Pengkodean maksimum adalah I, atau skor 40. Pengkodean berkualitas baik memiliki skor 33 atau lebih, atau dengan kata lain, B ke atas.
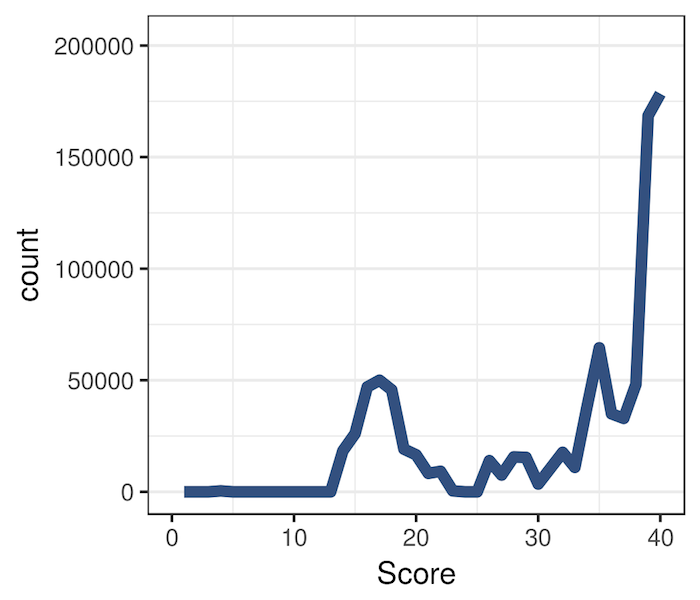
Anda dapat melihat detail pengkodean untuk Illumina di sini.
- Skor manakah yang paling banyak terwakili pada gambar?
Latihan ini merupakan bagian dari kursus
Pengantar Bioconductor di R
Latihan interaktif langsung
Ubah teori menjadi aksi dengan salah satu latihan interaktif kami
 Mulai latihan