Gráfico de qualidade por base
Esta figura foi criada para você a partir das codificações de qualidade de base de um arquivo fastq completo. Este arquivo usa codificação Illumina. A codificação máxima é I, ou uma pontuação de 40. Codificações de boa qualidade têm pontuações de 33 ou mais, ou seja, são B ou superiores.
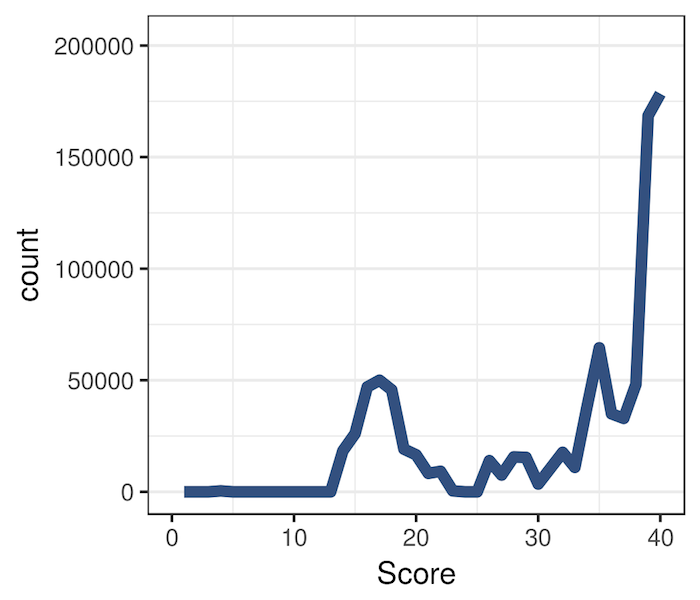
Você pode ver os detalhes de codificação da Illumina aqui.
- Quais pontuações são as mais representadas na figura?
Este exercicio faz parte do curso
Introdução ao Bioconductor em R
exercicio interativo prático
Transforme teoria em prática com um dos nossos exercicio interativos
 Iniciar exercicio