Influencia del previo y los datos en el posterior
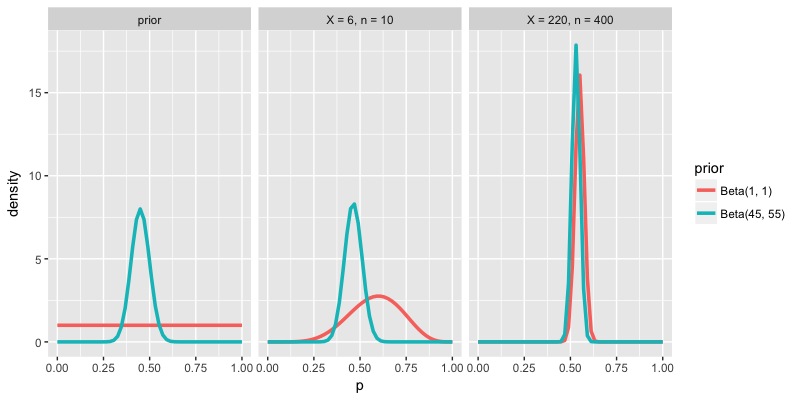
Examina los gráficos de densidad de abajo. El primer conjunto de gráficos de densidad muestra 2 posibles previos para tu soporte subyacente \(p\). Los otros 2 conjuntos de gráficos de densidad muestran los modelos posteriores para \(p\) que resultan de estos previos y de distintos datos de encuesta \(X\) y \(n\). ¿Cuál de las siguientes opciones describe mejor la influencia combinada del previo y los datos en el posterior?
Este ejercicio forma parte del curso
Modelado bayesiano con RJAGS
ejercicio interactivo práctico
Convierte la teoría en práctica con uno de nuestros ejercicios interactivos
 Empezar ejercicio