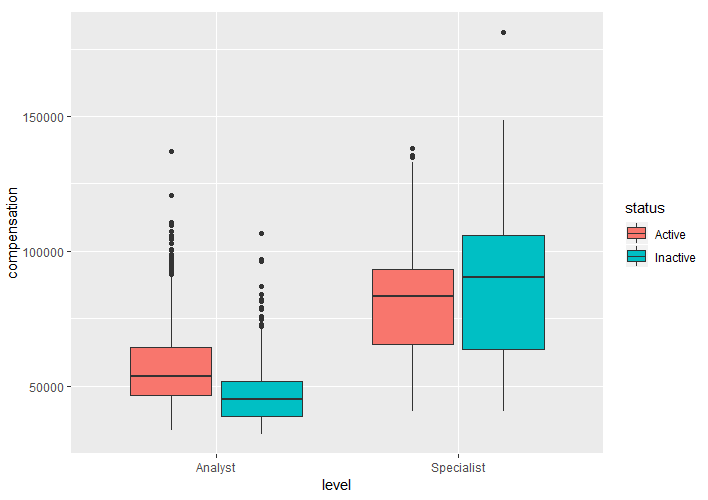
下图展示了 Analyst 和 Specialist 级别中,Active 与 Inactive 员工的薪酬分布。
Analyst
Specialist
Active
Inactive
请查看该图,并在下方选择正确的选项:
本练习是课程的一部分
通过我们的互动练习之一,将理论转化为实践
本章首先概述员工流失/离职,并结合员工分享的离职原因。您将学习如何计算离职率,并从不同维度分析离职率。您还将为分析识别人才细分,并整合来自多个 HR 数据源的相关数据,以获得更有价值的洞见。
在本章中,您将基于现有数据创建新变量,用于解释员工离职。您将分析薪酬数据,并创建 compa-ratio(薪酬比)来衡量全体员工的薪酬公平性。为识别影响离职的最重要变量,您将使用信息值(Information Value,IV)的概念。
当前练习
在本章中,您将构建逻辑回归模型来预测离职,并考虑变量之间的多重共线性。
在本章中,您将计算模型的准确性,并将员工归入特定的风险分层。随后,您将制定干预策略,并计算该策略的 ROI。