La frontiera efficiente
Uno dei modi per costruire la frontiera efficiente rischio/rendimento dato un insieme di asset è generare casualmente combinazioni e tracciare le caratteristiche di ciascun portafoglio. In questo grafico, l'asse x rappresenta il rischio (deviazione standard) e l'asse y il rendimento atteso di ogni portafoglio.
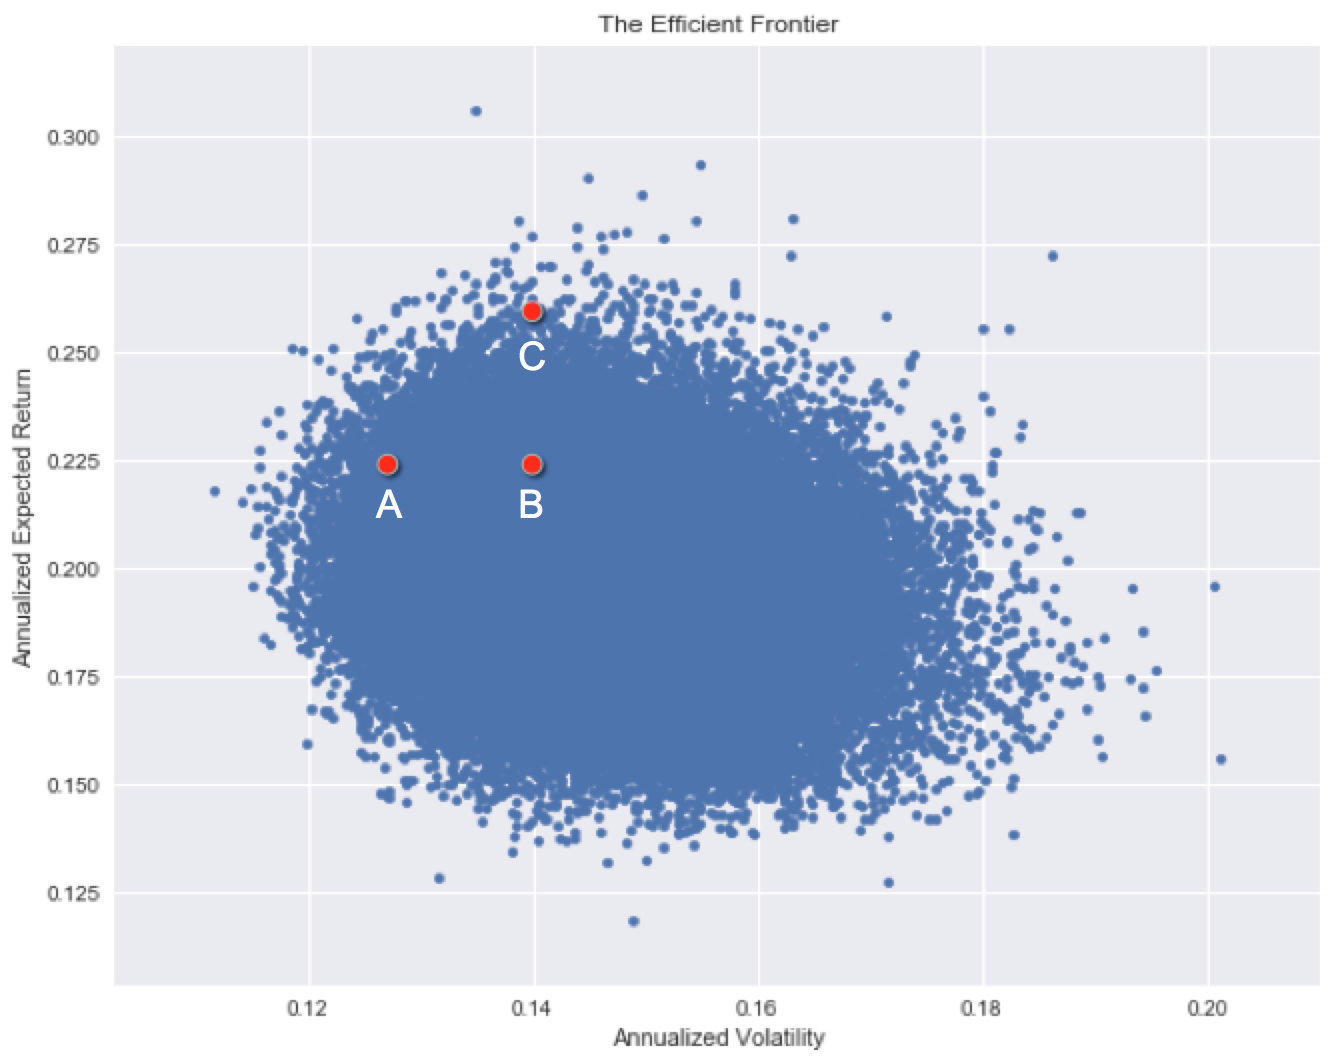
Ogni investimento ha un livello di rischio storico e un rendimento storico. Nota come alcuni asset siano stati storicamente superiori ad altri, mentre tra alcuni è più difficile scegliere.
Quale investimento ha le migliori caratteristiche storiche rischio/rendimento?
Questo esercizio fa parte del corso
Introduzione alla gestione del rischio di portafoglio in Python
esercizio interattivo pratico
Trasforma la teoria in pratica con uno dei nostri esercizi interattivi
 Inizia esercizio