Divario retributivo
Il grafico seguente mostra la distribuzione della retribuzione per i dipendenti Active e Inactive ai livelli Analyst e Specialist.
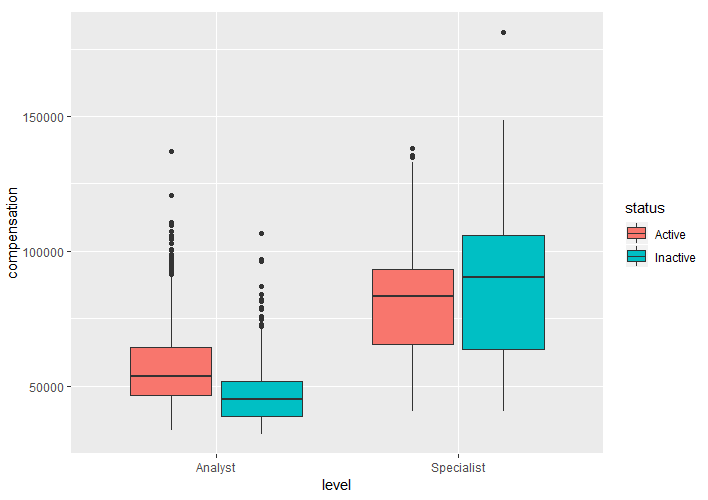
Esamina il grafico e seleziona l’opzione corretta qui sotto:
Questo esercizio fa parte del corso
HR Analytics: prevedere il turnover dei dipendenti in R
esercizio interattivo pratico
Trasforma la teoria in pratica con uno dei nostri esercizi interattivi
 Inizia esercizio